A. Analyse the statistical significance of the coefficient estimates in Table 1 at the 5% lev B.Consider both the F-statistic (at the 5% level of significance) and the adjusted R- squared as t forecast horizon increases from 1 quarter to 3 years. Interpret these figures for the 3-year horiz output in Table 1. Provide some commentary and briefly discuss whether such results a consistent with PPP theory.
A. Analyse the statistical significance of the coefficient estimates in Table 1 at the 5% lev B.Consider both the F-statistic (at the 5% level of significance) and the adjusted R- squared as t forecast horizon increases from 1 quarter to 3 years. Interpret these figures for the 3-year horiz output in Table 1. Provide some commentary and briefly discuss whether such results a consistent with PPP theory.

Linear Algebra: A Modern Introduction
4th Edition
ISBN:9781285463247
Author:David Poole
Publisher:David Poole
Chapter2: Systems Of Linear Equations
Section2.4: Applications
Problem 23EQ:
23. Consider a simple economy with just two industries: farming and manufacturing. Farming consumes...

Related questions
Question
100%
Please solve With the all subparts with the step and explaining solution. Please no reject thank u
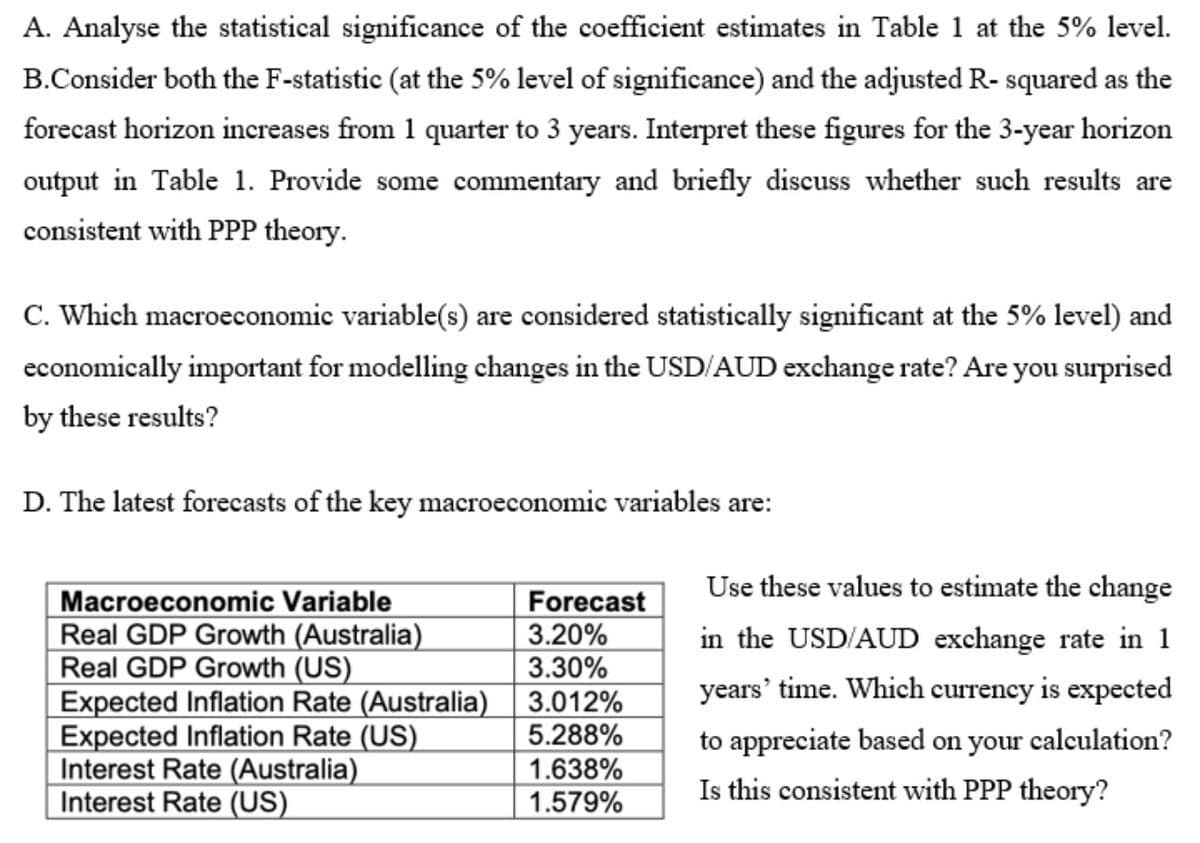
Transcribed Image Text:A. Analyse the statistical significance of the coefficient estimates in Table 1 at the 5% level.
B.Consider both the F-statistic (at the 5% level of significance) and the adjusted R- squared as the
forecast horizon increases from 1 quarter to 3 years. Interpret these figures for the 3-year horizon
output in Table 1. Provide some commentary and briefly discuss whether such results are
consistent with PPP theory.
C. Which macroeconomic variable(s) are considered statistically significant at the 5% level) and
economically important for modelling changes in the USD/AUD exchange rate? Are you surprised
by these results?
D. The latest forecasts of the key macroeconomic variables are:
Use these values to estimate the change
Macroeconomic Variable
Real GDP Growth (Australia)
Real GDP Growth (US)
Expected Inflation Rate (Australia)
Expected Inflation Rate (US)
Interest Rate (Australia)
Interest Rate (US)
Forecast
3.20%
3.30%
in the USD/AUD exchange rate in 1
years' time. Which currency is expected
3.012%
5.288%
to appreciate based on your calculation?
1.638%
1.579%
Is this consistent with PPP theory?
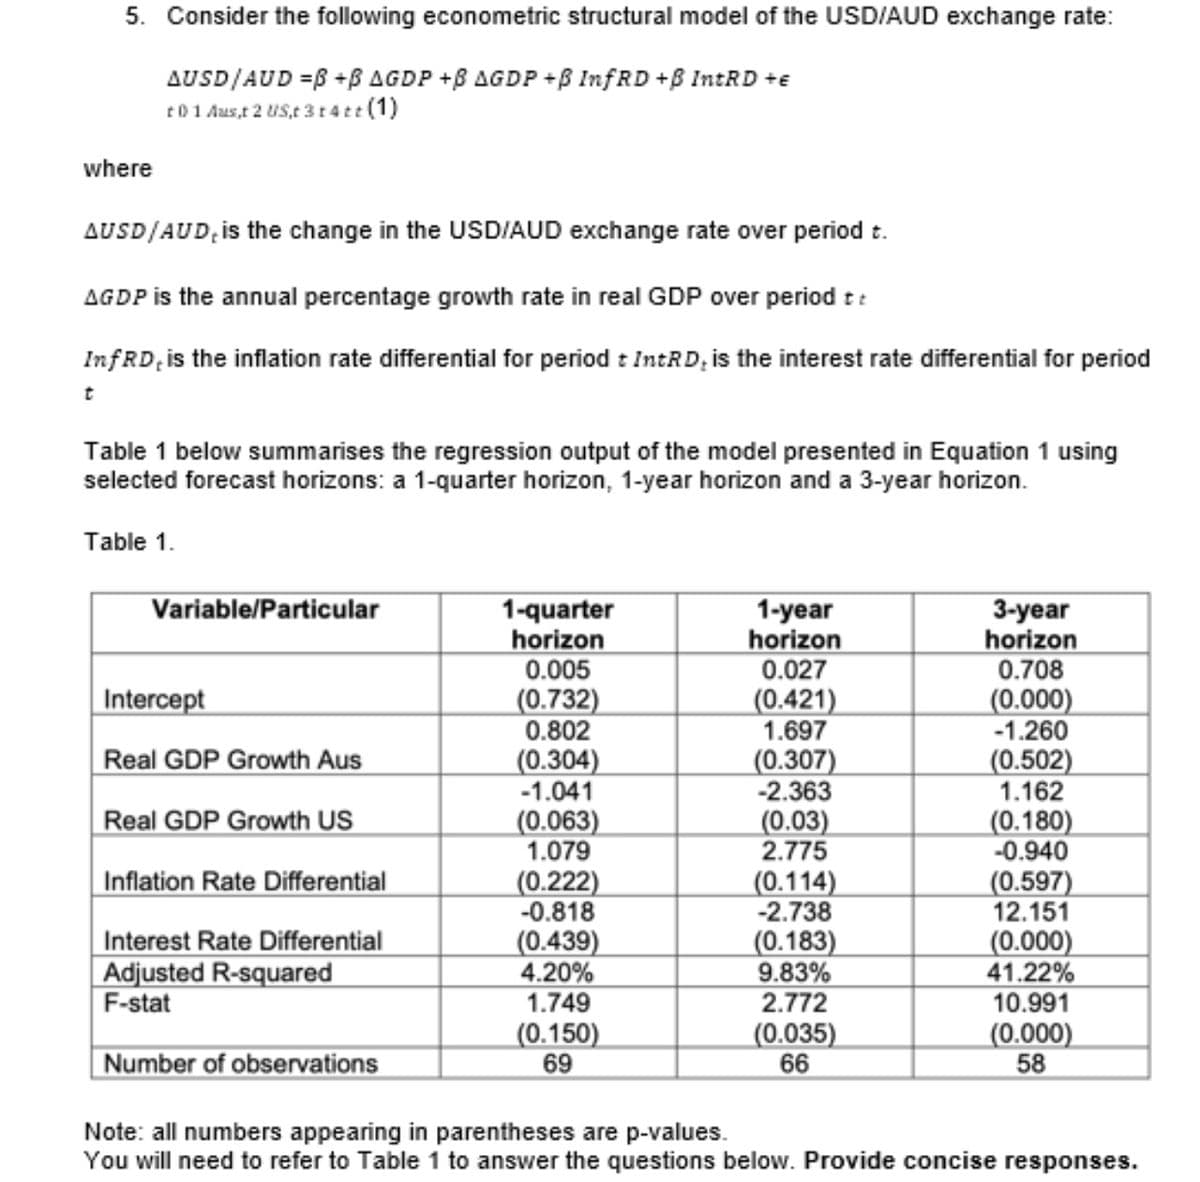
Transcribed Image Text:5. Consider the following econometric structural model of the USD/AUD exchange rate:
AUSD/AUD =B +B AGDP +B AGDP +B InfRD +B INTRD +e
t01 Aus,t 2 US,t 3 t4tt (1)
where
AUSD/AUD, is the change in the USD/AUD exchange rate over period t.
AGDP is the annual percentage growth rate in real GDP over period t:
InfRD, is the inflation rate differential for period : IntRD; is the interest rate differential for period
Table 1 below summarises the regression output of the model presented in Equation 1 using
selected forecast horizons: a 1-quarter horizon, 1-year horizon and a 3-year horizon.
Table 1.
Variable/Particular
1-quarter
horizon
0.005
(0.732)
0.802
1-year
horizon
0.027
3-year
horizon
0.708
Intercept
(0.421)
1.697
(0.000)
-1.260
(0.502)
1.162
Real GDP Growth Aus
(0.304)
-1.041
(0.063)
1.079
(0.307)
-2.363
(0.03)
2.775
Real GDP Growth US
(0.180)
-0.940
Inflation Rate Differential
(0.222)
-0.818
(0.114)
-2.738
(0.183)
9.83%
2.772
(0.597)
12.151
Interest Rate Differential
Adjusted R-squared
F-stat
(0.439)
4.20%
1.749
(0.150)
69
(0.000)
41.22%
10.991
(0.000)
58
Number of observations
(0.035)
66
Note: all numbers appearing in parentheses are p-values.
You will need to refer to Table 1 to answer the questions below. Provide concise responses.
Expert Solution
This question has been solved!
Explore an expertly crafted, step-by-step solution for a thorough understanding of key concepts.

This is a popular solution!

Trending now
This is a popular solution!

Step by step
Solved in 3 steps

Recommended textbooks for you
Linear Algebra: A Modern Introduction
Algebra
ISBN:
9781285463247
Author:
David Poole
Publisher:
Cengage Learning
Linear Algebra: A Modern Introduction
Algebra
ISBN:
9781285463247
Author:
David Poole
Publisher:
Cengage Learning