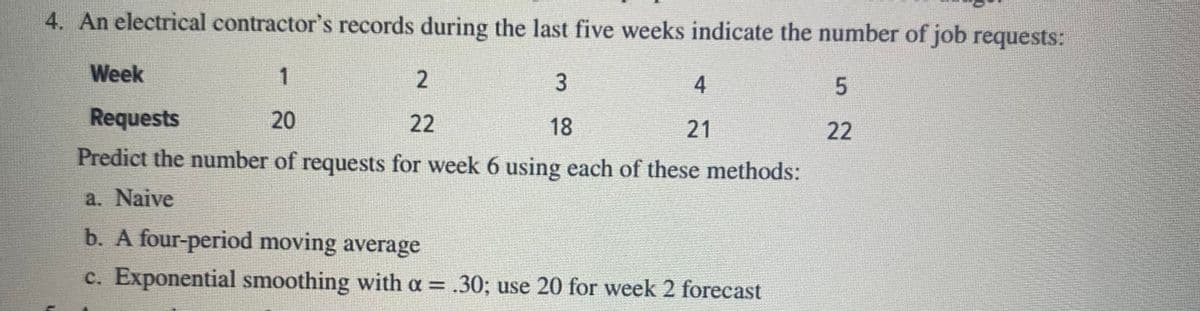
a. Naive b. A four-period moving average c. Exponential smoothing with a = .30; use 20 for week 2 forecast %3D


Q: formula refers Naive Forecast method. O a. Forecast value for the current period = Last
A: To compute a naïve forecast just require the earlier month of sales and plug it in close to the…
Q: Week Passengers 440 11 446 12 451 13 455 14 464 15 996 474 17 476 18 482 a. Explain why an averaging…
A: After observing the data, we can see that there is an upward increasing trend. In case the average…
Q: Forecast is calculating estimates of future cycle/s based on data of past cycles -- there is no?
A: The strategy is the set of different activities and plans that helps to achieve the organizational…
Q: Exponential Smoothing Forecasting Use the area below to draw a line chart for single exponential…
A: Exponential Smoothing Forecasting Ft+1 = At-1×α+1-αFt Error = Actual data -Forecast data Mean…
Q: Suppose the three last values were 20, 19, 20 respectively. Using the naive method, the next…
A: The following is the data provided: Period Data January 20 February 19 March 20 The…
Q: 10. What is the approximate forecast for May using a four-month moving average? a.38 b.43 c.44 d. 47
A: Given data is
Q: a. Plot the monthly sales data. Do you observe any trend, cycles or random variations? b. Forecast…
A: Forecasting is a technique that uses recorded data as inputs to make instructed estimates that are…
Q: Which of the following is used to describe the degree of forecast error? a. Median and Mode b. Mean…
A: Mean absolute percent error is the method to describe the degree of relationship between errors for…
Q: Illustrate one example/scenario when judgmental forecast is utilized.
A: Forecasting is the process of predicting the future demand based on historic data or information.
Q: The forecast for week 6 is ___ service calls (round to two decimals and show your work)
A: Forecasting is the process of prediction in which sales demand is estimated using historic…
Q: Discussion #1 & #2
A: As per the Bartleby Honor code we are not supposed to answer more than 1 question at a time. Please…
Q: a. A linear trend equation. b. A four-month moving average. C. Exponential smoothing with a…
A: Since you have posted a question with multiple sub-parts, we will solve the first three subparts for…
Q: c) What is this year's forecast using exponential smoothing with alpha = 0.4, if year 2017's…
A: The concept of Operation Management: Operation management is the management that applies to a…
Q: 6.For a random process, the most appropriate forecast is the naive forecast True or False
A: According to the random walk hypothesis, stock market values fluctuate at random and cannot be…
Q: Predict the number of requests for week 6 using each of these methods: a. Naïve b. A four period…
A: Forecasting is the process of estimating the future demand according to the previous or historic…
Q: Develop a 3-weck weighted average forecast for Week 4 through 9 with weights WI - W2 = W3 = 0.2 0.3…
A: A moving average based on weighted average puts weight on the data gathered recently, by multiplying…
Q: i. What are the 3-months moving average forecasts for months 4, 5, 6 & 7? ii. What are the 3-month…
A: Forecasting is estimated predictions for the present as well as for the future as per the past data.…
Q: Forecasting Forecasting is important relative to capacity requirements planning. What are some of…
A: Qualitative data forecasting techniques mainly describes the characteristics and qualities of the…
Q: Forecasting time horizons include:a) long range. b) medium range.c) short range. d) all of the…
A: Forecasting is that of the method by that managers make estimates about future events. It's…
Q: a. Plot the monthly data b. Forecast September sales using: i. A linear trend equation ii. A…
A: THE ANSWER IS AS BELOW:
Q: snip
A: Forecasting is the method of making predictions of the future based on past and present information…
Q: The forecast for the month of November was higher than the actual demand and the forecast for the…
A:
Q: Forecasting is utilized in which of the following areas? A) product demand B. process design (c) new…
A: Efficiency is the ability to reduce or eliminate the wastage of resources, money, and time in an…
Q: 2)Auto sales over a 4-month period were forecasted as follows: 89, 98, 105, and 97. The actual…
A: Auto sales over a 4-month period - Month Actual Forecast 1 92 89 2 96 98 3 101 105 4 100…
Q: exponential smoothing with a smoothing constant equal to .20, assuming a March forecast of 19(00).
A: To find Exponential smoothing with a smoothing constant equal to .20, assuming a March forecast of…
Q: AD, M Moving Average Model (past 3 Weeks), A. B. Exponential Smoothing Model (a = 0.2) с. What is…
A: Forecasting is a technique used to predict future outcomes on the basis of past data. In businesses…
Q: 1. A dry cleaner uses exponential smoothing to forecast equipment usage at its main plant. August…
A: Since you have asked multiple questions, we will solve the first question with its sub-parts for…
Q: 1. Compute the exponentially smoothed forecast of calls for each week. Assume an initial forecast of…
A: THE ANSWER IS AS BELOW:
Q: Question 18 A tire company needs a forecast for studded tires in the next forecast period. The…
A: Given: A smoothing constant of alpha = 0.20. The demand for the most recent period = 100 The…
Q: Weekly demand for an item averaged 100 units over the past year. Actual demand forthe next eight…
A:
Q: 101 Management's Forecast 122 114 a) What is the MAD for the forecast developed by management sales…
A: MAD shows the average deviations of the forecasted values in comparison to actual sales. MAPE is…
Q: Sales Month (000 units) Feb. 19 Mar. 18 Apг. May 15 20 Jun. 18 Jul. 22 Aug. 20 a. Plot the monthly…
A: The known data is given below:
Q: Forecast is calculating estimates of future cycle/s based on data of past cycles, there is no…
A: Forecasting is the way toward making expectations dependent on over a significant time span…
Q: a) Calculate the three-period moving-average forecast for periods 7 through 10. Three-period Period…
A: Given data is
Q: b) Use exponential smoothing with a smoothing constant of 0.30 to forecast the sales. Assume that…
A: The Exponentially Weighted Moving Average (EWMA) is a quantitative or factual measure used to…
Q: Statement I Statement 2 SC Middle manager are the ones responsible for setting operations goals and…
A: In Bartleby's policy, providing reference is not allowed.
Q: Forecasts are generally wrong.a. Why are forecasts generally wrong?b. Explain the term “wrong” as it…
A: Forecasting generally means predicting or estimating something for future events. It is also about…
Q: (3) A weighted average using.60 for August, .30 for July, and .10 for June (4) Exponential smoothing…
A: Forecasting is the process of prediction in which sales demand is estimated using historic…
Q: Develop a three-week moving average. A.What is the forecast for week 5? (Make sure no decimal place…
A: Since you have posted a question with multiple sub-parts, we will solve the first three subparts for…
Q: IST STATEMENT: Forecast that are too low mean the company has not allocated enough resources that…
A: “Hi and thanks for your questions as you have asked for multiple questions at a time we will be…
Q: 1. It has been said that forecasting using exponential smoothing is like driving a car by looking in…
A: As specified, I have solved the second question for you. Kindly find it's answer ahead and post the…
Q: Passenger miles flown on Northeast Airlines, a commuter firm serving the Boston hub, are shown for…
A:
Q: Bradley's Copiers sells and repairs photocopy machines. The manager needs weekly forecasts of…
A: Given data-
Q: Using the double exponential smoothing forecast, is it possible to forecast a demand thatis bigger…
A: Forecasting is a prediction method that can use historical data and current market trends and…
Q: irlines company approaches you to suggest ossible methods for an effective Forecast and 's…
A: Forecasting refers to making predictions regarding the future variables. It is widely used in…
help please I need it in excel


Trending now
This is a popular solution!

Step by step
Solved in 2 steps with 6 images

- The file P13_42.xlsx contains monthly data on consumer revolving credit (in millions of dollars) through credit unions. a. Use these data to forecast consumer revolving credit through credit unions for the next 12 months. Do it in two ways. First, fit an exponential trend to the series. Second, use Holts method with optimized smoothing constants. b. Which of these two methods appears to provide the best forecasts? Answer by comparing their MAPE values.Under what conditions might a firm use multiple forecasting methods?The file P13_22.xlsx contains total monthly U.S. retail sales data. While holding out the final six months of observations for validation purposes, use the method of moving averages with a carefully chosen span to forecast U.S. retail sales in the next year. Comment on the performance of your model. What makes this time series more challenging to forecast?
- The Baker Company wants to develop a budget to predict how overhead costs vary with activity levels. Management is trying to decide whether direct labor hours (DLH) or units produced is the better measure of activity for the firm. Monthly data for the preceding 24 months appear in the file P13_40.xlsx. Use regression analysis to determine which measure, DLH or Units (or both), should be used for the budget. How would the regression equation be used to obtain the budget for the firms overhead costs?The file P13_26.xlsx contains the monthly number of airline tickets sold by the CareFree Travel Agency. a. Create a time series chart of the data. Based on what you see, which of the exponential smoothing models do you think will provide the best forecasting model? Why? b. Use simple exponential smoothing to forecast these data, using a smoothing constant of 0.1. c. Repeat part b, but search for the smoothing constant that makes RMSE as small as possible. Does it make much of an improvement over the model in part b?The file P13_02.xlsx contains five years of monthly data on sales (number of units sold) for a particular company. The company suspects that except for random noise, its sales are growing by a constant percentage each month and will continue to do so for at least the near future. a. Explain briefly whether the plot of the series visually supports the companys suspicion. b. By what percentage are sales increasing each month? c. What is the MAPE for the forecast model in part b? In words, what does it measure? Considering its magnitude, does the model seem to be doing a good job? d. In words, how does the model make forecasts for future months? Specifically, given the forecast value for the last month in the data set, what simple arithmetic could you use to obtain forecasts for the next few months?
- The owner of a restaurant in Bloomington, Indiana, has recorded sales data for the past 19 years. He has also recorded data on potentially relevant variables. The data are listed in the file P13_17.xlsx. a. Estimate a simple regression equation involving annual sales (the dependent variable) and the size of the population residing within 10 miles of the restaurant (the explanatory variable). Interpret R-square for this regression. b. Add another explanatory variableannual advertising expendituresto the regression equation in part a. Estimate and interpret this expanded equation. How does the R-square value for this multiple regression equation compare to that of the simple regression equation estimated in part a? Explain any difference between the two R-square values. How can you use the adjusted R-squares for a comparison of the two equations? c. Add one more explanatory variable to the multiple regression equation estimated in part b. In particular, estimate and interpret the coefficients of a multiple regression equation that includes the previous years advertising expenditure. How does the inclusion of this third explanatory variable affect the R-square, compared to the corresponding values for the equation of part b? Explain any changes in this value. What does the adjusted R-square for the new equation tell you?The file P13_28.xlsx contains monthly retail sales of U.S. liquor stores. a. Is seasonality present in these data? If so, characterize the seasonality pattern. b. Use Winters method to forecast this series with smoothing constants = = 0.1 and = 0.3. Does the forecast series seem to track the seasonal pattern well? What are your forecasts for the next 12 months?The file P13_29.xlsx contains monthly time series data for total U.S. retail sales of building materials (which includes retail sales of building materials, hardware and garden supply stores, and mobile home dealers). a. Is seasonality present in these data? If so, characterize the seasonality pattern. b. Use Winters method to forecast this series with smoothing constants = = 0.1 and = 0.3. Does the forecast series seem to track the seasonal pattern well? What are your forecasts for the next 12 months?
- The file P13_25.xlsx contains the quarterly numbers of applications for home mortgage loans at a branch office of Northern Central Bank. a. Create a time series chart of the data. Based on what you see, which of the exponential smoothing models do you think will provide the best forecasting model? Why? b. Use simple exponential smoothing to forecast these data, using a smoothing constant of 0.1. c. Repeat part b, but search for the smoothing constant that makes RMSE as small as possible. Does it make much of an improvement over the model in part b? Is it guaranteed to produce better forecasts for the future?The file P13_19.xlsx contains the weekly sales of a particular brand of paper towels at a supermarket for a one-year period. a. Using a span of 3, forecast the sales of this product for the next 10 weeks with the moving averages method. How well does this method with span 3 forecast the known observations in this series? b. Repeat part a with a span of 10. c. Which of these two spans appears to be more appropriate? Justify your choice.Bradley's Copiers sells and repairs photocopy machines. The manager needs weekly forecasts of service calls so that he can schedule service personnel. Use the actual demand in the first period for the forecast for the first week so error measurement begins in the second week. The manager uses exponential smoothing with alpha = 0.5 Forecast the number of calls for week 6, which is next week. Week Actual service calls 1 28 2 36 3 38 4 25 5 25 The forecast for week 6 is ___ service calls (round to two decimals and show your work)

