Absenteeism: Absenteeism can be a serious employment problem. It is estimated that absenteeism reduces potential output by more than 10%. Two economists launched a research project to learn more about the problem. They randomly selected 100 organizations to participate in a 1-year study. For each organization, they recorded the average number of days absent per employee and several variables thought to affect absenteeism. Management’s goal here is to analyze the data and determine which factors may be helpful in predicting absenteeism. Now let us build a model to predict absenteeism based on key independent variables available in this dataset; wage, PctPT, PctU, Av Shift and U/MRel. Correlation matrix is provided below. Why are the variables AvShift and U/MRel excluded from this correlation matrix? Which variable in the matrix is likely to provide the best simple linear regression model and why? Does the correlation matrix show any evidence of collinearity? Explain. Data: Wage Pct PT Pct U Av Shift U/M Rel Absent 22477 8.5 57.1 1 1 5.4 29939 1.9 41.5 0 1 4.1 22957 12.2 52.6 1 0 11.5 18888 30.8 65.1 0 1 2.1 15078 6.8 68.8 0 1 5.9 15481 5.1 46.4 0 0 12.9 21481 25.3 38.9 0 1 3.5 29687 9.2 17.2 0 0 2.6 13603 8.4 12.9 0 0 8.6 18303 4.9 18.1 0 1 2.7 20832 23.8 64.4 1 1 6.6 22325 24.1 63.7 1 1 2.1 19964 8.6 12.2 0 1 3.8 32496 5.9 11.8 1 0 4.3 15795 2.9 25.8 0 1 4.3 21138 24.3 53.2 0 0 2.2 18859 20.6 22.8 1 1 8.6 12023 9 49.8 1 1 10.8 33272 24 39.1 1 0 2.9 22325 11.9 32.6 1 0 5.3 26147 0 67.7 1 0 8.2 33229 11.7 10.8 0 0 2.8 37970 14.6 25.5 1 1 2.4 15281 27.2 31.8 0 0 2.8 19423 17.2 35 1 1 5 26587 13.9 41.9 1 1 9.5 22963 2.6 52.9 0 1 4.3 26404 6.4 64.4 0 1 8.9 16315 4.9 69.7 0 1 7.2 26759 23.2 61.8 1 1 5.6 30824 13.2 52.1 0 1 2.4 31979 27.7 57.4 1 1 2.7 23135 7 15.2 0 0 13.4 18014 0 38.7 1 0 14.8 18541 13.8 69.4 1 1 10.7 16747 9.9 67.2 1 0 10.3 13473 6.3 47.8 0 1 4.6 42986 13.4 24.5 1 0 3.9 23964 8.8 79.4 1 0 13.3 30794 0.4 12.1 1 0 2.2 21104 14.7 71 0 1 5.7 19137 7.7 28 1 0 11.8 26058 7.3 45.6 0 1 2.5 22085 6.8 25.4 0 1 2.1 29044 8.6 40.6 0 0 4.1 24205 19.6 25.1 1 1 4.9 17698 10.8 42.3 1 1 7.7 26399 4.5 63.3 1 1 6.3 40590 15.9 69.4 1 1 2.9 24805 5.7 17.7 1 1 2.6 18899 13.1 54.8 1 1 6.1 26802 15.5 46.5 0 1 6 30034 11.8 53.2 1 0 6.7 15713 16.6 41.2 1 0 11.9 18280 6.4 65 1 1 9.3 41009 6.7 54.9 0 1 3.6 24021 14 20.6 1 1 2.6 21836 27.6 29 0 1 2.1 21157 5.5 50.2 1 1 9 19529 14.5 56.6 1 0 11 31240 26.3 36.4 1 1 2.9 20963 0 0 1 1 2.2 33826 8.2 87.9 0 1 3.3


Inverse Normal Distribution
The method used for finding the corresponding z-critical value in a normal distribution using the known probability is said to be an inverse normal distribution. The inverse normal distribution is a continuous probability distribution with a family of two parameters.
Mean, Median, Mode
It is a descriptive summary of a data set. It can be defined by using some of the measures. The central tendencies do not provide information regarding individual data from the dataset. However, they give a summary of the data set. The central tendency or measure of central tendency is a central or typical value for a probability distribution.
Z-Scores
A z-score is a unit of measurement used in statistics to describe the position of a raw score in terms of its distance from the mean, measured with reference to standard deviation from the mean. Z-scores are useful in statistics because they allow comparison between two scores that belong to different normal distributions.
Absenteeism: Absenteeism can be a serious employment problem. It is estimated that absenteeism reduces potential output by more than 10%. Two economists launched a research project to learn more about the problem. They randomly selected 100 organizations to participate in a 1-year study. For each organization, they recorded the average number of days absent per employee and several variables thought to affect absenteeism. Management’s goal here is to analyze the data and determine which factors may be helpful in predicting absenteeism.
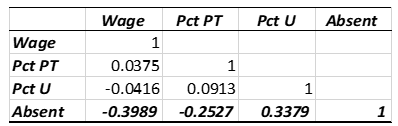
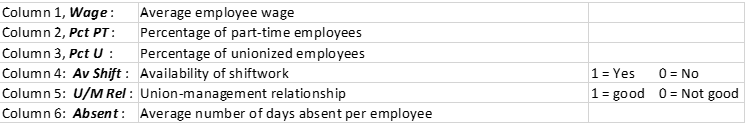
Now let us build a model to predict absenteeism based on key independent variables available in this dataset; wage, PctPT, PctU, Av Shift and U/MRel.
Why are the variables AvShift and U/MRel excluded from this correlation matrix?
Which variable in the matrix is likely to provide the best simple linear regression model and why?
Does the correlation matrix show any evidence of collinearity? Explain.
Data:
| Wage | Pct PT | Pct U | Av Shift | U/M Rel | Absent |
| 22477 | 8.5 | 57.1 | 1 | 1 | 5.4 |
| 29939 | 1.9 | 41.5 | 0 | 1 | 4.1 |
| 22957 | 12.2 | 52.6 | 1 | 0 | 11.5 |
| 18888 | 30.8 | 65.1 | 0 | 1 | 2.1 |
| 15078 | 6.8 | 68.8 | 0 | 1 | 5.9 |
| 15481 | 5.1 | 46.4 | 0 | 0 | 12.9 |
| 21481 | 25.3 | 38.9 | 0 | 1 | 3.5 |
| 29687 | 9.2 | 17.2 | 0 | 0 | 2.6 |
| 13603 | 8.4 | 12.9 | 0 | 0 | 8.6 |
| 18303 | 4.9 | 18.1 | 0 | 1 | 2.7 |
| 20832 | 23.8 | 64.4 | 1 | 1 | 6.6 |
| 22325 | 24.1 | 63.7 | 1 | 1 | 2.1 |
| 19964 | 8.6 | 12.2 | 0 | 1 | 3.8 |
| 32496 | 5.9 | 11.8 | 1 | 0 | 4.3 |
| 15795 | 2.9 | 25.8 | 0 | 1 | 4.3 |
| 21138 | 24.3 | 53.2 | 0 | 0 | 2.2 |
| 18859 | 20.6 | 22.8 | 1 | 1 | 8.6 |
| 12023 | 9 | 49.8 | 1 | 1 | 10.8 |
| 33272 | 24 | 39.1 | 1 | 0 | 2.9 |
| 22325 | 11.9 | 32.6 | 1 | 0 | 5.3 |
| 26147 | 0 | 67.7 | 1 | 0 | 8.2 |
| 33229 | 11.7 | 10.8 | 0 | 0 | 2.8 |
| 37970 | 14.6 | 25.5 | 1 | 1 | 2.4 |
| 15281 | 27.2 | 31.8 | 0 | 0 | 2.8 |
| 19423 | 17.2 | 35 | 1 | 1 | 5 |
| 26587 | 13.9 | 41.9 | 1 | 1 | 9.5 |
| 22963 | 2.6 | 52.9 | 0 | 1 | 4.3 |
| 26404 | 6.4 | 64.4 | 0 | 1 | 8.9 |
| 16315 | 4.9 | 69.7 | 0 | 1 | 7.2 |
| 26759 | 23.2 | 61.8 | 1 | 1 | 5.6 |
| 30824 | 13.2 | 52.1 | 0 | 1 | 2.4 |
| 31979 | 27.7 | 57.4 | 1 | 1 | 2.7 |
| 23135 | 7 | 15.2 | 0 | 0 | 13.4 |
| 18014 | 0 | 38.7 | 1 | 0 | 14.8 |
| 18541 | 13.8 | 69.4 | 1 | 1 | 10.7 |
| 16747 | 9.9 | 67.2 | 1 | 0 | 10.3 |
| 13473 | 6.3 | 47.8 | 0 | 1 | 4.6 |
| 42986 | 13.4 | 24.5 | 1 | 0 | 3.9 |
| 23964 | 8.8 | 79.4 | 1 | 0 | 13.3 |
| 30794 | 0.4 | 12.1 | 1 | 0 | 2.2 |
| 21104 | 14.7 | 71 | 0 | 1 | 5.7 |
| 19137 | 7.7 | 28 | 1 | 0 | 11.8 |
| 26058 | 7.3 | 45.6 | 0 | 1 | 2.5 |
| 22085 | 6.8 | 25.4 | 0 | 1 | 2.1 |
| 29044 | 8.6 | 40.6 | 0 | 0 | 4.1 |
| 24205 | 19.6 | 25.1 | 1 | 1 | 4.9 |
| 17698 | 10.8 | 42.3 | 1 | 1 | 7.7 |
| 26399 | 4.5 | 63.3 | 1 | 1 | 6.3 |
| 40590 | 15.9 | 69.4 | 1 | 1 | 2.9 |
| 24805 | 5.7 | 17.7 | 1 | 1 | 2.6 |
| 18899 | 13.1 | 54.8 | 1 | 1 | 6.1 |
| 26802 | 15.5 | 46.5 | 0 | 1 | 6 |
| 30034 | 11.8 | 53.2 | 1 | 0 | 6.7 |
| 15713 | 16.6 | 41.2 | 1 | 0 | 11.9 |
| 18280 | 6.4 | 65 | 1 | 1 | 9.3 |
| 41009 | 6.7 | 54.9 | 0 | 1 | 3.6 |
| 24021 | 14 | 20.6 | 1 | 1 | 2.6 |
| 21836 | 27.6 | 29 | 0 | 1 | 2.1 |
| 21157 | 5.5 | 50.2 | 1 | 1 | 9 |
| 19529 | 14.5 | 56.6 | 1 | 0 | 11 |
| 31240 | 26.3 | 36.4 | 1 | 1 | 2.9 |
| 20963 | 0 | 0 | 1 | 1 | 2.2 |
| 33826 | 8.2 | 87.9 | 0 | 1 | 3.3 |
| 23349 | 0 | 38.5 | 1 | 1 | 5.9 |
| 22695 | 25.4 | 47 | 1 | 1 | 4 |
| 30475 | 0 | 69.3 | 1 | 0 | 10.8 |
| 16631 | 5.9 | 48.2 | 1 | 1 | 7.1 |
| 28996 | 18.6 | 29.3 | 1 | 1 | 2.9 |
| 15807 | 16.9 | 42.9 | 1 | 1 | 6.2 |
| 15585 | 0 | 59.4 | 1 | 0 | 10.3 |
| 18466 | 9 | 69.4 | 1 | 0 | 13.5 |
| 35140 | 21.1 | 37.1 | 1 | 1 | 6.7 |
| 33459 | 14.1 | 19.5 | 1 | 1 | 2.6 |
| 24357 | 0 | 21.5 | 1 | 1 | 5.2 |
| 19370 | 3.7 | 35 | 1 | 1 | 7.2 |
| 21820 | 6.3 | 0 | 1 | 1 | 3.5 |
| 23351 | 12.3 | 27.1 | 1 | 1 | 5.4 |
| 22938 | 6.8 | 68.5 | 1 | 1 | 5.8 |
| 16477 | 10 | 61.5 | 1 | 1 | 11.7 |
| 20790 | 28.5 | 59.9 | 1 | 0 | 5.6 |
| 20352 | 19.4 | 34.6 | 1 | 0 | 4.6 |
| 19743 | 14.3 | 39.7 | 1 | 0 | 8.6 |
| 22775 | 10.3 | 35.7 | 1 | 1 | 2.1 |
| 24229 | 0.9 | 26.7 | 1 | 0 | 9.6 |
| 41195 | 8.6 | 66.7 | 1 | 0 | 4 |
| 23143 | 4.2 | 63.1 | 0 | 1 | 10.6 |
| 13400 | 28.1 | 46.7 | 0 | 0 | 5.8 |
| 21371 | 14.9 | 78.9 | 1 | 0 | 7.4 |
| 28675 | 7.7 | 63.4 | 0 | 0 | 10.3 |
| 18171 | 6.9 | 47.9 | 0 | 1 | 6.3 |
| 23670 | 20.5 | 46.3 | 1 | 1 | 6.7 |
| 29745 | 6.1 | 53.9 | 1 | 0 | 6.7 |
| 14672 | 13.9 | 46 | 1 | 0 | 13.3 |
| 20382 | 0 | 38.6 | 1 | 1 | 4.1 |
| 24952 | 14.6 | 53.8 | 0 | 1 | 4.6 |
| 28878 | 7.4 | 12.2 | 1 | 1 | 2.7 |
| 24558 | 24.5 | 37 | 1 | 1 | 8 |
| 20447 | 0.9 | 27.4 | 1 | 1 | 4.2 |
| 27714 | 8.7 | 58.1 | 0 | 0 | 9 |
| 18116 | 3.5 | 47.5 | 1 | 1 | 7.7 |

Step by step
Solved in 2 steps


