Question Help A jourmal reported a study examining the possible impact of air pollution on the weight of babies. Researchers found that 9% of 161 babies born to mothers who were exposed to heavy doses of air pollution in a city were classified as having low birthweight. Only 5% of 2400 babies bom in another hospital in the city whose mothers had not been exposed to air pollution were similarly classified. Does this indicate a possibility that air pollution might be linked to a significantly higher proportion of low-weight babies? a) Test an appropriate hypothesis at a =0.10 and state your conclusion. b) f you concluded there is a difference, estimate that difference with a confidence interval and interpret that interval in context. a) Let p, be the proportion of low-weight babies born to mothers who were exposed to air pollution and p, be the proportion of low-weight babies born to mothers who were not exposed to air pollution. Identify the null and alternative hypotheses. OA Ho: P1- P2 = 0 HA: P - P2 <0 O B. Ho: P1-P2 <0 HA: PI- P2 =0 OC. Hg: P - P2 = 0 HA: P1 - P2 >0 OD. Ho: P1- P2= 0 HAi P-P2 #0 Identify the test statistic. (Round to two decimal places as needed.) Identify the P-value from the output of the hypothesis test. (Round to three decimal places as needed.)
Question Help A jourmal reported a study examining the possible impact of air pollution on the weight of babies. Researchers found that 9% of 161 babies born to mothers who were exposed to heavy doses of air pollution in a city were classified as having low birthweight. Only 5% of 2400 babies bom in another hospital in the city whose mothers had not been exposed to air pollution were similarly classified. Does this indicate a possibility that air pollution might be linked to a significantly higher proportion of low-weight babies? a) Test an appropriate hypothesis at a =0.10 and state your conclusion. b) f you concluded there is a difference, estimate that difference with a confidence interval and interpret that interval in context. a) Let p, be the proportion of low-weight babies born to mothers who were exposed to air pollution and p, be the proportion of low-weight babies born to mothers who were not exposed to air pollution. Identify the null and alternative hypotheses. OA Ho: P1- P2 = 0 HA: P - P2 <0 O B. Ho: P1-P2 <0 HA: PI- P2 =0 OC. Hg: P - P2 = 0 HA: P1 - P2 >0 OD. Ho: P1- P2= 0 HAi P-P2 #0 Identify the test statistic. (Round to two decimal places as needed.) Identify the P-value from the output of the hypothesis test. (Round to three decimal places as needed.)

Glencoe Algebra 1, Student Edition, 9780079039897, 0079039898, 2018
18th Edition
ISBN:9780079039897
Author:Carter
Publisher:Carter
Chapter10: Statistics
Section10.6: Summarizing Categorical Data
Problem 10CYU

Related questions
Topic Video
Question
It’s all one question
Transcribed Image Text:Question Help ▼
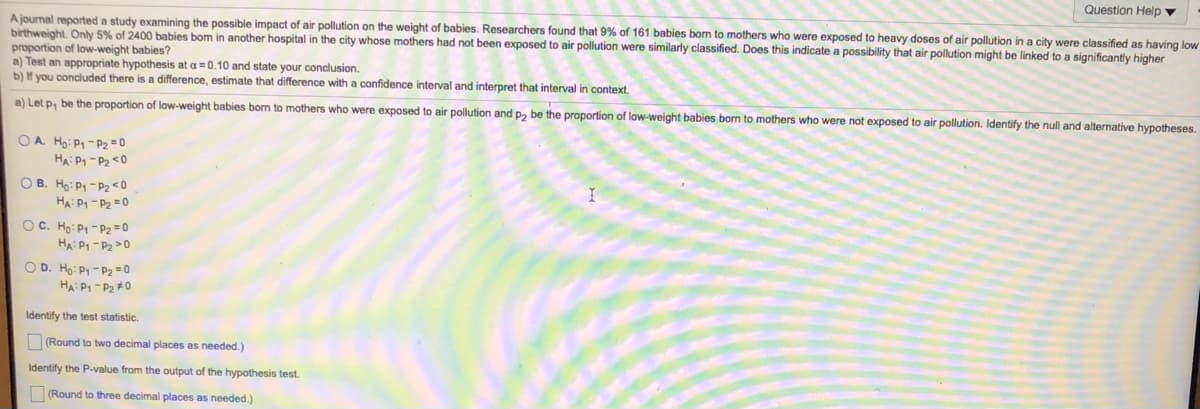
A jourmal reported a study examining the possible impact of air pollution on the weight of babies. Researchers found that 9% of 161 babies born to mothers who were exposed to heavy doses of air pollution in a city were classified
birthweight. Only 5% of 2400 babies bom in another hospital in the city whose mothers had not been exposed to air pollution were similarly classified. Does this indicate a possibility that air pollution might be linked to a significantly higher
proportion of low-weight babies?
a) Test an appropriate hypothesis at a = 0.10 and state your conclusion.
b) If you concluded there is a difference, estimate that difference with a confidence interval and interpret that interval in context.
s having low
a) Let p, be the proportion of low-weight babies born to mothers who were exposed to air pollution and p, be the proportion of low-weight babies born to mothers who were not exposed to air pollution. Identify the null and alternative hypotheses.
OA Ho: P1 - P2 = 0
HA P1 -P2 <0
O B. Ho: P- P2 <0
HA: P1 - P2 =0
OC. Ho: P1 - P2= 0
HA: P1 - P2 >0
O D. Ho: P1 - P2 = 0
HA: P1 - P2 #0
Identify the test statistic.
(Round to two decimal places as needed.)
Identify the P-value from the output of the hypothesis test.
(Round to three decimal places as needed.)
Transcribed Image Text:Question Help v
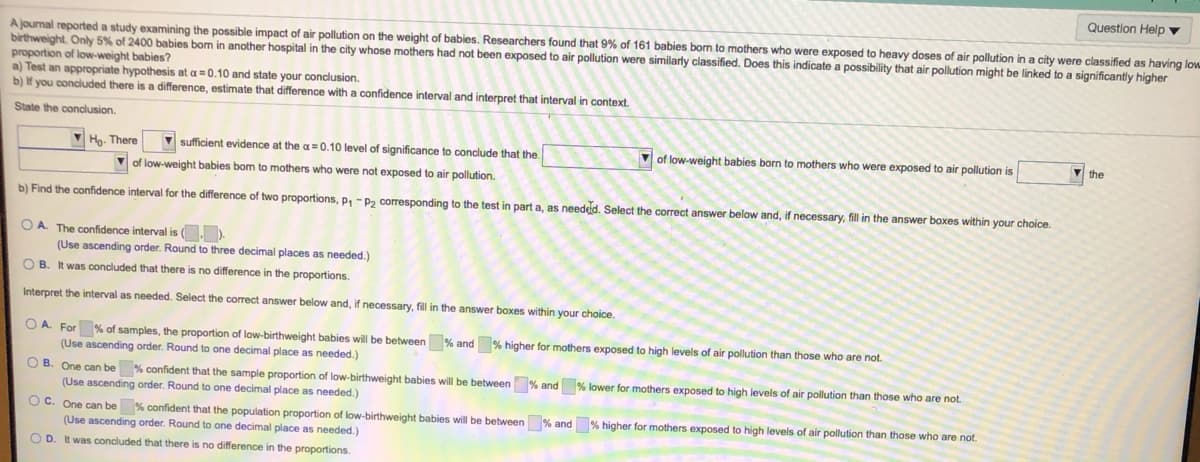
Ajournal reported a study examining the possible impact of air pollution on the weight of babies. Researchers found that 9% of 161 babies born to mothers who were exposed to heavy doses of air pollution in a city were classified as having low
birthweight. Only 5% of 2400 babies bom in another hospital in the city whose mothers had not been exposed to air pollution were similarly classified. Does this indicate a possibility that air pollution might be linked to a significantly higher
proportion of low-weight babies?
Test an appropriate hypothesis at a=0.10 and state your conclusion.
b) If you concluded there is a difference, estimate that difference with a confidence interval and interpret that interval in context.
State the conclusion.
V Ho. There
V sufficient evidence at the a = 0.10 level of significance to conclude that the
V of low-weight babies born
mothers who were exposed to air pollution is
V the
V of low-weight babies bom to mothers who were not exposed to air pollution.
b) Find the confidence interval for the difference of two proportions, p, -P2 corresponding to the test in part a, as needed. Select the correct answer below and, if necessary, fill in the answer boxes within your choice.
O A The confidence interval is .)
(Use ascending order. Round to three decimal places as needed.)
O B. It was concluded that there is no difference in the proportions.
Interpret the interval as needed. Select the correct answer below and, if necessary, fil in the answer boxes within your choice.
O A. For % of samples, the proportion of low-birthweight babies will be between % and % higher for mothers exposed to high levels of air pollution than those who are not.
(Use ascending order. Round to one decimal place as needed.)
O B. One can be % confident that the sample proportion of low-birthweight babies will be between % and % lower for mothers exposed to high levels of air pollution than those who are not.
(Use ascending order. Round to one decimal place as needed.)
OC. One can be % confident that the population proportion of low-birthweight babies will be between % and % higher for mothers exposed to high levels of air pollution than those who are not.
(Use ascending order. Round to one decimal place as needed.)
O D. It was concluded that there is no difference in the proportions.
Expert Solution
This question has been solved!
Explore an expertly crafted, step-by-step solution for a thorough understanding of key concepts.

This is a popular solution!

Trending now
This is a popular solution!

Step by step
Solved in 4 steps with 2 images

Knowledge Booster


Learn more about
Need a deep-dive on the concept behind this application? Look no further. Learn more about this topic, statistics and related others by exploring similar questions and additional content below.Recommended textbooks for you
Glencoe Algebra 1, Student Edition, 9780079039897…
Algebra
ISBN:
9780079039897
Author:
Carter
Publisher:
McGraw Hill

College Algebra (MindTap Course List)
Algebra
ISBN:
9781305652231
Author:
R. David Gustafson, Jeff Hughes
Publisher:
Cengage Learning

Glencoe Algebra 1, Student Edition, 9780079039897…
Algebra
ISBN:
9780079039897
Author:
Carter
Publisher:
McGraw Hill
College Algebra (MindTap Course List)
Algebra
ISBN:
9781305652231
Author:
R. David Gustafson, Jeff Hughes
Publisher:
Cengage Learning