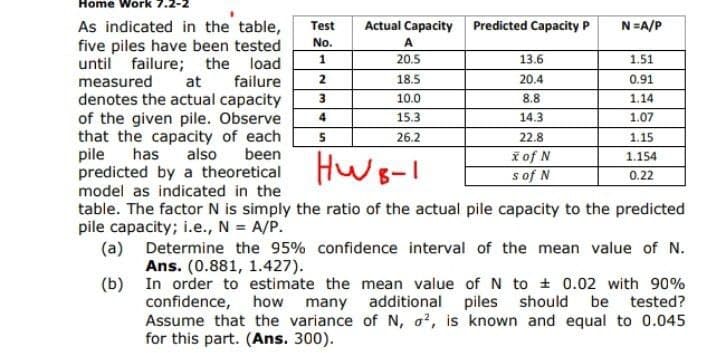
Actual Capacity As indicated in the table, five piles have been tested until failure; the load Test Predicted Capacity P N=A/P No. A 1 20.5 13.6 1.51 measured at failure 18.5 20.4 0.91 denotes the actual capacity of the given pile. Observe that the capacity of each pile has predicted by a theoretical 3. 10.0 8.8 1.14 4 15.3 14.3 1.07 26.2 22.8 1.15 HWs-I also been x of N s of N 1.154 0.22 model as indicated in the table. The factor N is simply the ratio of the actual pile capacity to the predicte pile capacity; i.e., N = A/P.
Actual Capacity As indicated in the table, five piles have been tested until failure; the load Test Predicted Capacity P N=A/P No. A 1 20.5 13.6 1.51 measured at failure 18.5 20.4 0.91 denotes the actual capacity of the given pile. Observe that the capacity of each pile has predicted by a theoretical 3. 10.0 8.8 1.14 4 15.3 14.3 1.07 26.2 22.8 1.15 HWs-I also been x of N s of N 1.154 0.22 model as indicated in the table. The factor N is simply the ratio of the actual pile capacity to the predicte pile capacity; i.e., N = A/P.

MATLAB: An Introduction with Applications
6th Edition
ISBN:9781119256830
Author:Amos Gilat
Publisher:Amos Gilat
Chapter1: Starting With Matlab
Section: Chapter Questions
Problem 1P

Related questions
Question
i need the answer quickly
Transcribed Image Text:Home Work
Actual Capacity
Predicted Capacity P
As indicated in the table,
five piles have been tested
until failure; the load
measured
denotes the actual capacity
of the given pile. Observe
that the capacity of each
pile has also
Test
N=A/P
No.
A
20.5
13.6
1.51
at
failure
2
18.5
20.4
0.91
3
10.0
8.8
1.14
4
15.3
14.3
1.07
26.2
22.8
1.15
i of N
s of N
been
1.154
predicted by a theoretical HWg-1
0.22
model as indicated in the
table. The factor N is simply the ratio of the actual pile capacity to the predicted
pile capacity; i.e., N = A/P.
(a) Determine the 95% confidence interval of the mean value of N.
Ans. (0.881, 1.427).
(b) In order to estimate the mean value of N to + 0.02 with 90%
confidence, how many additional piles should be tested?
Assume that the variance of N, a?, is known and equal to 0.045
for this part. (Ans. 300).
Expert Solution
This question has been solved!
Explore an expertly crafted, step-by-step solution for a thorough understanding of key concepts.

Step by step
Solved in 4 steps

Recommended textbooks for you
MATLAB: An Introduction with Applications
Statistics
ISBN:
9781119256830
Author:
Amos Gilat
Publisher:
John Wiley & Sons Inc

Probability and Statistics for Engineering and th…
Statistics
ISBN:
9781305251809
Author:
Jay L. Devore
Publisher:
Cengage Learning

Statistics for The Behavioral Sciences (MindTap C…
Statistics
ISBN:
9781305504912
Author:
Frederick J Gravetter, Larry B. Wallnau
Publisher:
Cengage Learning
MATLAB: An Introduction with Applications
Statistics
ISBN:
9781119256830
Author:
Amos Gilat
Publisher:
John Wiley & Sons Inc
Probability and Statistics for Engineering and th…
Statistics
ISBN:
9781305251809
Author:
Jay L. Devore
Publisher:
Cengage Learning
Statistics for The Behavioral Sciences (MindTap C…
Statistics
ISBN:
9781305504912
Author:
Frederick J Gravetter, Larry B. Wallnau
Publisher:
Cengage Learning

Elementary Statistics: Picturing the World (7th E…
Statistics
ISBN:
9780134683416
Author:
Ron Larson, Betsy Farber
Publisher:
PEARSON

The Basic Practice of Statistics
Statistics
ISBN:
9781319042578
Author:
David S. Moore, William I. Notz, Michael A. Fligner
Publisher:
W. H. Freeman

Introduction to the Practice of Statistics
Statistics
ISBN:
9781319013387
Author:
David S. Moore, George P. McCabe, Bruce A. Craig
Publisher:
W. H. Freeman