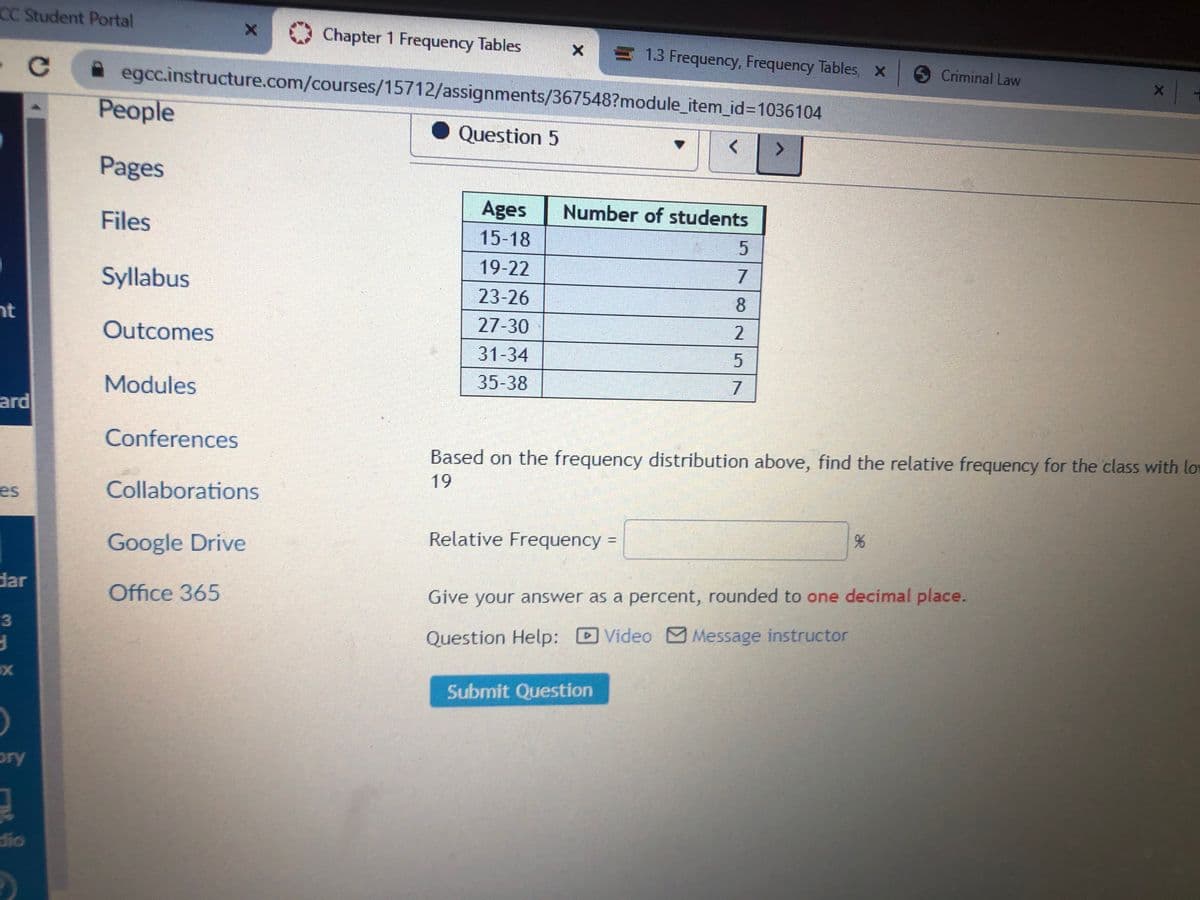
Ages Number of students 15-18 19-22 7 23-26 8 27-30 31-34 35-38 Based on the frequency distribution above, find the relative frequency for the class with la 19 Relative Frequency = 2.


Q: Ages Number of students 15-18 10 19-22 3 23-26 10 27-30 7 31-34 4 35-38 3 Based on the frequency…
A: From the provided information, The data can be shown below: Ages Number of students 15-18 10…
Q: TT Score Range (Classes) 200–299 300–399 Frequency 10 400–499 12 500–599 15 600-699 700–799 2 15.…
A: The frequency table can be given as: Classes Frequency 199.5-299.5 5 299.5-399.5 10…
Q: Ages Number of students 15-18 10 19-22 7 23-26 10 27-30 9 31-34 5 35-38 8 Based on the frequency…
A: Relative frequency = FrequencyTotal frequency
Q: Ages Number of students 15-18 19-22 23-26 27-30 31-34 35-38 etry this question below Cumulative…
A: Given data Class frequency cumulative frequency 15-18 5 5 19-22 2 7 23-26 2 9 27-30 5…
Q: Ages Number of students 15-18 3 19-22 23-26 10 27-30 2 31-34 3 35-38 10 Based on the frequency…
A: Frequency for a grouped data gives the number of observations in a class. For example if a class is…
Q: Ages Number of students 15-18 9 19-22 8 23-26 10 27-30 10 31-34 6 35-38 9 Based on…
A: Given data and calculation of Relative Frequency
Q: ges Number of students 15-18 5 19-22 8 23-26 10 27-30 8 31-34 8 35-38 10 Based on the frequency…
A: Ages Number of students 15-18 5 19-22 8 23-26 10 27-30 8 31-34 8 35-38 10 total n =…
Q: Ages Number of students 15-18 7 19-22 9. 23-26 27-30 31-34 8 35-38 9. Based on the frequency…
A: Frequency Distribution: In Statistical theory, a frequency distribution is a tabular, listed or…
Q: Ages Number of students 15-18 8 19-22 8 23-26 3 27-30 10 31-34 3 35-38 5 Find the…
A: Relative Frequency= Frequency of Class/ Total Frequency Frequency of lower class limit 19 is 8 Total…
Q: Ages Number of students 15-18 8 19-22 6 23-26 9 27-30 2 31-34 3 35-38 7 Based on the frequency…
A:
Q: Ages Number of students 15-18 4 19-22 3 23-26 8 27-30 31-34 35-38 Based on the frequency…
A: Relative frequency formula :- Relative frequency = Class frequency Total frequencies
Q: Class 80-82 frequency 5, class 83-85 frequency 4, class 86-88 frequency 8, 89-91 10, 92-94 3 A.…
A: Solution
Q: Ages Number of students 15-18 2 19-22 8 23-26 7 27-30 4 31-34 7 35-38 10 Based on the frequency…
A: Ages number of students relative frequency 15-18 2 238×100=5.3% 19-22 8 838×100=21.1% 23-26 7…
Q: Ages Number of students 15-18 2 19-22 4 23-26 4 27-30 3 31-34 35-38 9. Based on the frequency…
A: Given data : Total frequency = 2+4+4+3+2+9 = 24 To find: Based on…
Q: Ages Number of students 15-18 19-22 23-26 27-30 31-34 35-38 Based on the frequency distribution…
A: We know that Relative frequency = each frequency/ total number of frequency
Q: Ages Number of students 15-18 5 19-22 9 23-26 2 27-30 10 31-34 10 35-38 2 Find the…
A:
Q: Ages Number of students 15-18 3 19-22 8 23-26…
A: In grouped data, observations are clustered into groups. The groups and the corresponding…
Q: Ages number of students 15-18 4 19-22 6 23-26…
A: Given Data : Ages number of students 15-18 4 19-22 6 23-26…
Q: Ages Number of students 15-18 7 19-22 3 23-26 27-30 31-34 35-38 Based on the frequency distribution…
A: Ages X Number of students frequency f Relative frequency fN Relative frequency in % 15-18 7…
Q: Ages Number of students 15-18 10 19-22 6 23-26 4 27-30 5 31-34 5 35-38 4 Based on the frequency…
A: Given that the frequency distribution table: Ages Number of students 15-18 10 19-22 6 23-26…
Q: Ages Number of students 15-18 8 19-22 5 23-26 3 27-30 8 31-34 5 35-38 10 Based on the frequency…
A:
Q: Age in years Frequency 15-19 7 20-24…
A:
Q: Ages Number of students 15-18 19-22 5 23-26 27-30 31-34 4 35-38 10 Based on the frequency…
A:
Q: Ages Number of students 15-18 2 19-22 4 23-26 7 27-30 8 31-34 8 35-38 8 Based on the freq
A: We are given the frequency distribution. Total number of students = 2+4+7+8+8+8 = 37 We need to…
Q: Study Hours 10 Frequency 5 30 8 20 7 20 6 15 5 10 Above is a frequency distribution of the number of…
A: Given data, What is the percentage for students who studied for 7 hours?
Q: Ages Number of students 15-18 19-22 4 23-26 8 27-30 31-34 35-38 Based on the frequency distribution…
A:
Q: Ages Number of students 15-18 5 19-22 3 23-26 8 27-30 8 31-34 3 35-38 9 Based on the…
A: A relative frequency is the percentage of frequency according to the classes. It can be calculated…
Q: 4, 2, 1, 0, 5, 0, 3, 2, 0, 0, 1, 1, 3, 1, 2, 1, 1, 3, 4, 0, 2, 1, 0, 0, 2, 2, 1, 0 4) Create a…
A: Frequency Distribution Table Bin Frequency 0 8 1 8 2 6 3 3 4 2 5 1
Q: Ages Number of students 15-18 19-22 23-26 27-30 4. 31-34 35-38 Based on the frequency distribution…
A: Given data, Find relative frequency for class 15-18
Q: Ages Number of students 15-18 19-22 23-26 27-30 31-34 35-38 2 9 7 3 9 5 Based on the frequency…
A:
Q: Ages 15-18 Number of students 7 19-22 23-26 27-30 31-34 9. 35-38 Based on the frequency distribution…
A:
Q: Ages Number of students 15-18 7 19-22 8 23-26 6 27-30 3 31-34 2 35-38 10 Based on the frequency…
A:
Q: Ages Number of students 15-18 4 19-22 7 23-26 3 27-30 6 31-34 2 35-38 6 Find the…
A: Given data table is,AgesNumber of students15-18419-22723-26327-30631-34235-386
Q: Number Ages students of 15- 18 10 19. 10 22 23 26 27- 30 31- 34 3 35 38 Based on the frequency…
A:
Q: Ages Number of students 15-18 8. 19-22 7. 23-26 27-30 8 8. 31-34 35-38 3 5 Based on the frequency…
A:
Q: The frequency distribution below summarizes employee years of service for Alpha Corporation.…
A: Given data is not continuous series .The data is in inclusive series , so, we have to convert it…
Q: Ages Number of students 15-18 5 19-22 5 23-26 5 27-30 8 31-34 8 35-38 2 Based on the frequency…
A: Relative frequency: Relative frequency is obtained by dividing the respective frequencies of each…
Q: Ages Number of students 15-18 19-22 3 23-26 3 27-30 3. 31-34 35-38 3. Find the relative frequency…
A: In grouped data, observations are clustered into groups. The groups and the corresponding…
Q: Ages Number of students 15-18 19-22 23-26 4 27-30 10 31-34 4 35-38 6. Based on the frequency…
A: Given Information: The relative frequency can be determined as follows:
Q: Ages Number of students 15-18 3 19-22 10 23-26 9 27-30 8 31-34 7 35-38 3 Based on the frequency…
A: Given, Formula for relative frequency =Number of student in a particular class/ Total number of…
Q: Ages Number of students 15-18 2 19-22 10 23-26 5 27-
A: Ages Number of students 15-18 2 19-22 10 23-26 5 27-30 4 31-34 5 35-38 3
Q: find the relative frequency for the class 23-26. Relative frequency = __________________% Give…
A: From the above data we are gievn that The frequency distribution table Ages Number of students…
Q: Ages Number of students 15-18 19-22 23-26 10 27-30 2. 31-34 3 35-38 10 Based on the frequency…
A: In grouped data, observations are clustered into groups. The groups and the corresponding…
Q: 35-38 4 Based on the frequency distribution above, find the cumulative frequency for the class 27-30…
A: Ages Number of students cf 15-18 7 7 19-22 3 10 23-26 3 13 27-30 5 18 31-34 9 27 35-38 4…
Q: Ages Number of students 15-18 3 19-22 23-26 10 27-30 7 31-34 35-38 Based on the frequency…
A: Formula for Relative frequency is ,
Q: Instructions: Construct a frequency distribution table for the following. Relative frequency should…
A: Introduction: There are three categories of customers according to civil status- S, M, and W.
Q: Ages Number of students 15-18 3 19-22 7 23-26 6. 27-30 10 31-34 35-38 7 Based on the frequency…
A: Frequency for an interval represents the number of observations that lie in that interval. For…
Q: Number of students Ages 15-18 2 19-22 4 23-26 27-30 31-34 3 35-38 7 Based on the frequency…
A: Given data is Ages Number of students 15-18 2 19-22 4 23-26 5 27-30 6 31-34 3 35-38 7…
Q: Ages Number of students 15-18 8 19-22 10 23-26 6. 27-30 31-34 3. 35-38 Based on the frequency…
A: From the provided information, Ages Number of Students 15-18 8 19-22 10 23-26…
Q: Ages Number of students 15-18 19-22 23-26 3 27-30 31-34 8 35-38 9. Based on the frequency…
A: Ages Number of students Cumulative frequency 15-18 5 5 19-22 5 5+5=10 23-26 3 10+3=13 27=30…


Trending now
This is a popular solution!

Step by step
Solved in 2 steps


- The data file includes the text of three books of the Bible (Joshua, Jonah and Philippians) using the ESV translation. While these are all great books, our only interest for this project is how often each letter is used. 1) In the Word file containing the Biblical text, use the “Find” feature to identify how many times each letter occurs (i.e. the letter’s frequency). Create an Excel spreadsheet to display the number of occurrences of each letter in the English alphabet. Using the find feature, here is the amount for each letter in alphabet A 1810 B 323 C 442 D 1097 E 2845 F 609 G 416 H 1689 I 1381 J 134 K 143 L 935 M 586 N 1503 O 2237 P 379 Q 5 R 1362 S 1407 T 2235 U 703 V 257 W 513 X 17 Z 6 2) In the Excel spreadsheet, sum your frequencies to compute the total number of letters in the 3 books (this is n). a) In your…The data file includes the text of three books of the Bible (Joshua, Jonah and Philippians) using the ESV translation. While these are all great books, our only interest for this project is how often each letter is used. 1) In the Word file containing the Biblical text, use the “Find” feature to identify how many times each letter occurs (i.e. the letter’s frequency). Create an Excel spreadsheet to display the number of occurrences of each letter in the English alphabet. Here is the amount of occurences I found for each letter using the find feature A=1810 B=323 C=442 D=1097 E=2845 F=609 G=416 H=1689 I=1381 J=134 K=143 L=935 M=586 N=1503 O=2237 P=379 Q=5 R=1362 S=1407 T=2235 U=703 V=257 W=513 X=17 Z=6 2) In the Excel spreadsheet, sum your frequencies to compute the total number of letters in the 3 books (this is n). a) In your spreadsheet, use the formula to compute the sample proportion of each letter’s appearances relative to total number of letters (i.e. find the relative…Researchers created two test sheets, each sheet showing 2020photos of the faces of dog‑owner pairs. The two sheets were equivalent with respect to breed, diversity of appearance, and gender of owners. On the first sheet the dogs were matched with their owners, while on the second sheet the dogs and owners were deliberately mismatched. Three experiments were conducted, and in all experiments, subjects were asked to "choose the set of dog‑owner pairs that resemble each other, Sheet 11or Sheet 22," and were simply told the aim of the research was a "survey on dog‑owner relationships." In the first experiment, the original sheets were shown to subjects; in the second experiment, just the mouth region of the owners was blacked out in all the pictures on both sheets; while in the third experiment, just the "eye region" of the owners was blacked out. Subjects were assigned at random to the three experimental groups, and in each experiment, the number of subjects who selected the sheet with…
- The data was collected on the time spent for preparation of exams by a class of statistics students before one week of examination data. The maximum time of study time was 47 hours and minimum time was 1 hour. If we want to construct a frequency table for the data with six classes, find the width of the class interval(round to nearest integer)Researchers investigated two kinds of laugh tracks – one with posed laughter and one with spontaneous laughter. Recall that to create the posed laughter laugh track, the researchers asked people to laugh and recorded the results. The researchers also tested the same 40 jokes with a spontaneous laughing laugh track, which they created by having people watch funny videos and recording their laughter. The data can be found in the file LaughTypes in pictures. Put these data into the Matched Pairs applet to investigate whether the type of laughter makes a difference in the ratings of the jokes and also do parts (a) (b) and (c):Determine the types of all variables obtained from this survey.
- the data was collected on the time spent for preparation of exams by a class of statistics students before one week of examination date. The maximum time of study time was 47 hours and minimum time was 1 hour. If we want to construct a frequency table for the datawith six classes, find the width of the class interval(round to nearest integer)Also represent this pattern on a scatter plotThe authors of a paper compared two different methods for measuring body fat percentage. One method uses ultrasound, and the other method uses X-ray technology. Body fat percentages using each of these methods for 16 athletes (a subset of the data given in a graph that appeared in the paper) are given in the accompanying table. You can assume that the 16 athletes who participated in this study are representative of the population of athletes. Athlete X-ray Ultrasound 1 5.00 4.25 2 12.00 8.75 3 9.25 9.00 4 12.00 11.75 5 17.25 17.00 6 29.50 27.50 7 5.50 6.50 8 6.00 6.75 9 8.00 8.75 10 9.50 10.50 11 9.25 9.50 12 11.00 12.00 13 12.00 12.25 14 14.00 15.50 15 17.00 18.00 16 18.00 18.25 Use these data to estimate the difference in mean body fat percentage measurement for the two methods. Use a confidence level of 95%. (Use ?d = ?X-ray − ?ultrasound. Round your answers to three decimal places.) , % Interpret the interval in…
- A data set consist of 2,2,3,4,5,5 and 7. Then 20 is added to the data set. The new value will havw little effect on the ________, but it will raise the _________ significantly.An average of 40 customers travel between Departments A and B each day. Unfortunately, Department C is located between Departments A and B, and no customers travel between Department C and Departments A and B. What is the load-distance score of this three department layout?I need help for finding the mode, since 10 is presented two times, and 26 is presented two times. Can there be more than one mode? What would the mode be for this data set? Also, if there are any corrections that i made mistakes on, please let me know!! Thank you!!