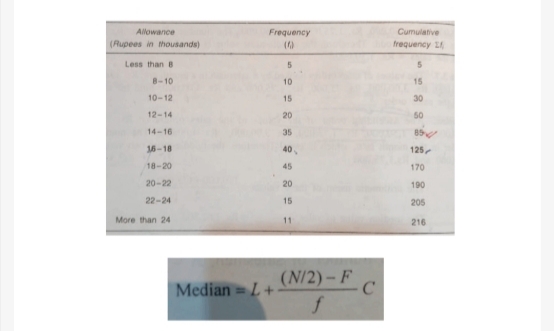
Allowance Frequency Cumulative (Rupees in thousands) frequency I Less than 8 8-10 10 15 10-12 15 30 12-14 20 50 14-16 35 16-18 40 125 18-20 45 170 20-22 20 190 22-24 15 205 More than 24 11 216 (N/2)-F Median = L+


Q: Lapse rates in the atmosphere Concurrent measurements indi-cate that at an elevation of 6.1 km, the…
A: Given: Concurrent measurements of the Lapse rates in the atmosphere, At an elevation, A=6.1 km, the…
Q: Grouped Data 1. The data below shows frequency distributions of fasting serum triglyceride of 100…
A: Given data is Serum Triglyceride Class Frequency(f) 60-76 14 77-93 17 94-110 31 111-127…
Q: Monthly Water Consumption (per cubic meter) Consumption Intervals 60-74 No. of families 11 75-89 9.…
A: Hello! As you have posted more than 3 sub parts, we are answering the first 3 sub-parts. In case…
Q: Class Interval Frequency (Scores) 0-2 2 3-5 4 6-8 10 9-11 13 12-14 17 15-17 18-20 8 Total Σf -60…
A: Consider the following table Class Interval Mid-value (x) Frequency (f) d=x-103 f×d Cf…
Q: Capacitance values between Class Frequency (µF) 94-95.9 7 96-97.9 19 98-99.9 35 100-101.9 31…
A:
Q: ACTIVITY 3. QUARTILES OF GROUPED DATA Directions: Complete the table and find Q1, Q2, and Q3 of the…
A: Complete table is given by; Lengths(mm) Real interval frequency(fi) Cumulative frequency(L.c.f)…
Q: Quality of Life Experienced by Women and Men (N= 171) WOMEN (n = 74) MEAN (SD) TABLE VI MEN (n= 97)…
A: The sample size used for Women and Men in the given study is 74 and 97. According to the assumptions…
Q: Monthly Water Consumption (per cubic meter) Consumption Intervals No. of families 60-74 11 75-89 9.…
A:
Q: Number of Multiple The data on the right represent the number of live multiple-delivery births…
A: Formula : Probability = number of favourable outcome/Total number of outcomes
Q: Temperature (°F) Frequency Class boundaries 45-47 48-50 3 51-53 54-56 11 57-59 7 60-62 7 63-65 1
A: The class intervals are given and it is asked to find the class boundaries. Here, the classes are…
Q: Frequency distribution of cigarette tax rates Tax Rate Frequency 0.00–0.49 0.50–0.99 14 1.00–1.49…
A: Since, the data is grouped. Calculate the middle points for each class interval using the formula:…
Q: 58.6 Also calculate cumulative frequency and midpoint.
A: The midpoint is calculated as Midpoint = (Upper Limit + Lower Limit)/2
Q: Constant 2020 Dollars for select years. Year Unadjusted Federal Minimum Wage Adjusted Federal…
A:
Q: Weights Freq Classmark Relative Freq <CF (а) - (b) (f) (k) 0.05 (0) (c) - 1.96 (g) (1) (m) 13 1.97 -…
A: Given data is Weights Freq Classmark Relative Freq <CF (a)-(b) (f) (k) 0.05 (o) (c)-1.96…
Q: Coefficients: Estimate Std. Error t value Pr(>Itl) (Intercept) 1.84416 0.09367 19.688 < 2e-16 ***…
A: This is the summary output of a regression model. Here the coefficients denotes the coefficients…
Q: eometric mean under A measure of lactation B measure of central tendency C Non
A: The geometric mean is defined as the average of a set of products. The geometric mean is a measure…
Q: Salary (pesos) 1001-2000 2001-3000 12 3001-4000 10 4001-5000 6 5001-6000 Compute the following: a.…
A: As per given table: Salary f Mid value(x) d=x-Ah: A=3500.5 f·d cf 1001-2000 7 1500.5 -2 -14 7…
Q: artile -r the 2 tive fre centile entile i NCE the fi nge. M ncom -24,0 22,0 20,00 18,00 6,00 4,000…
A:
Q: Relative Frequency Cumulative Midpoint Frequency Frequency 0.08 265 35.5 22 0.45 445 21 0.42 0.95…
A: Given : The given data is 22, 24, 24, 27, 29, 30, 32, 32, 32, 32, 33, 33, 33, 34, 37, 37, 37, 38,…
Q: Capacity (in TB) Price (in $) Disk drives have been getting larger. Their capacity is now often…
A: For the given data Find R2 =? INTERPRETATION
Q: Coefficients: Estimate Std. Error t value Pr(>Itl) 4248.71 17.201 97.43 (Intercept) 73082.38 2e-16…
A: A regression equation is used in forecasting.
Q: Frequency award was won Age (years) of Best Actress when award was won Cumulative 20-29 29 Frequency…
A:
Q: Class Boundaries Frequency midpoint TX (x) 7.5-12.5 12.5-17.5 17.5-22.5 15 22.5-27.5 27.5-32.5 2 mln
A: Given : Class Boundaries Frequency 7.5-12.5 3 12.5-17.5 5 17.5-22.5 15 22.5-27.5 5…
Q: USE SALT (a) Construct a relative frequency distribution for the city's rainfall data. (Round your…
A: It is given that the group reported the accompanying annual rainfall ( in inches ) for a particular…
Q: weight Interval Class Mid frequency cum≤f cum≥f f.m Frequency% 45≤50 47.5 3 3 29 142.5…
A: Given, Use the data in the frequency distribution table above to calculate and interpret/describe…
Q: Traveler Spending The data show the traveler spending in billions of dollars for a recent year for a…
A: Given: 20.5 33.1 21.7 58.3 23.4 110.7 30.4 24.9 75 60.9 40.2 45.9 65.9
Q: Time Relative Frequency 0-5 10% 20% 20% 5-10 10-20 20-30 10% 30-50 30%
A: Given data for number of movies seen per year classes Relative frequency 0-5 10% 5-10 20%…
Q: Relative Cumulative Class Limits Class Boundaries Midpoint Frequency Frequency Frequency 39 7.0 6.95…
A: “Since you have asked multiple question, we will solve the first question for you. If youwant any…
Q: Age group Frequency (f) Mid value (x) f*x (f* x )* x 10 - 20 15 45 675 20 - 30 14 25 350 8750 30 40…
A:
Q: Characteristic Relative Frequency Cumulative Frequency Grade f r% cf c% A 16 B 8…
A: Here, Given, Grade f A 16 B 8 C 7 D 5 F 4 Formula: Relative…
Q: Primary data is a. Always collected before secondary data O b. Usually collected through annual…
A: Primary data is a type of data that is collected by researchers directly from main sources through…
Q: Approximate the mean of the frequency distributioh för the ages of the resiu a town. nis of The…
A: The Arithmetic mean or the average, is the sum of a collection of numbers divided by the count of…
Q: Computed p-value 4. p = 0.01 5. p = 0.20 6. p = 0.005 Level of Significance a a =0.05 a =0.05 a…
A: It is given that the table shows samples of computed p-values and corresponding level of…
Q: d. Grouped data Complete the Frequency Distribution table by writing your answer in a paper, take…
A: We have to complete the frequency distribution table.
Q: Cumulative Frequency (More Than and Less Than): In a bank, the following were the deposits of…
A:
Q: Class Interval Frequency 30-39 11 40-49 46 50-59 70 60-69 45 70-79 16 80-89 1 from the table below…
A: From the given table the total frequency is 189and the third class frequency is 70
Q: The annual flows, in cubic meters per second, at the Weldon River at Mill Grove, Missouri for the…
A: We have given annual flow from 1930 to 1960 We have to fit lognormal distribution to the given data.…
Q: Frequency Annual Sales Annual Sales Frequency (Rs. '000) Less than 10 (Rs. '000) Less than 40 50 55…
A: Given data : class interval frequency 0 - 10 4 10 - 20 16 20 - 30 15 30 - 40 20 40 - 50…
Q: Range Demand Frequency Probability Cumulative Lower Higher Demand 10 5% 10 20 10% 20 50 25% 30 40…
A: we have assumed random numbers
Q: Time Frequency ... (X) (f) 7 10 8 9. 8. 10 9. 11 3 12 4 13 2 14 1 a) Mean Blank 1 b) Mode Blank 2 C)…
A: Data represents X values and corresponding their frequency . Solution: x(1) Frequency (f)(2)…
Q: Test Scores 1st Period 2nd Period 50 55 60 65 70 75 80 85 90 95 100 O The median for the first…
A: We have to find out correct statement for given data..
Q: Frequency 2. zziinn/Downloads/MAT119_Midterm_2021_Fall_1%2010-25(1).pdf .O D Page view A Read aloud…
A: The histogram is a plot which is used to depict the distribution of data with frequency on vertical…
Q: Frequency (Number of Students) 6 3 1 0 0-29 30-59 60-89 90-119 120-149 150-179 Time Watching TV…
A:
Q: Reliability data on an automated production machine are mean time between failures = 37.4 hr and…
A: Here, we have to calculate overall equipment effectiveness of the machine and value of utilization…
Q: Status Disease Present Disease Absent Marginal Total Test Positive 57 4 61 Test Negative 43 96 139…
A: Obtain the positive predictive value. The positive predictive value is obtained below as follows:…
Q: Data Frequency 40 - 44 13 45 - 49 18 50 - 54 12 55 - 59 60 - 64 2 Report mode and median accurate to…
A: Given Data : Since the interval 55-59 have zero frequency , we are adding up the last two intervals…
Q: Grade Relative Cumulative Frequency Distribution Frequency Frequency A 19.35% В 8 25.81% C 7 22.58%…
A: The cumulative frequency is calculated by adding all of the previous relative frequencies to the…
Q: Class limits Class boundaries Class midpoints Frequency Cumulative frequency 20 - 24 19.5 - 24.5 22…
A: we have to find out no.of values in the class 29.5-34.5
Q: Data Frequency 40-44 1 45- 49 3 50-54 5. 55-59 11 60 -64 16 65-69 13 70-74 6. 75- 79 0. 80-84
A: Given info:

Step by step
Solved in 2 steps


- Continued This is a continuation of Exercise 13. As we saw earlier, the stock turnover rate of an item is the number of times that the average inventory of the item needs to be replaced as a result of sales in a given time period. Suppose that a hardware store sells 80 shovels each year. a. Suppose that the hardware store maintains an average inventory of 5 shovels. What is the annual stock turnover rate for the shovels? How is this related to the yearly number of orders to the wholesaler needed to restock inventory? b. What would he the annual stock turnover rate if the store maintained an average inventory of 20 shovels? c. Write a formula expressing the annual stock turnover rate as a function of the average inventory of shovels, identify the function and the variable, and state the units.True/False Censoring occurs when the event of interest (e.g., disease status) is observed on every individual, usually due to time constraints. The incidence rate (IR), is computed by taking the ratio of the number of new cases of disease to the total number of person-time units available. The prevalence of a disease depends on the incidence of the disease as well as the duration of the disease.Incidence rate in the last influenza epidemic was found to be 50 per thousand (5%) of the population exposed. What should be the size of sample to find incidence rate in the current epidemic if allowable error is 0.005 and 0.01?
- Statistical question: Is the proportion of inner-city families living on a subsistence income: 20%? Two hundred families were randomly selected for the survey and 38 were found to have income at the subsistence level. Use the formal critical value method at 5% level of significance.Remember to show your steps (including all relevant information) and explicitly verify that all assumptions of the procedure are satisfied. show the steps on hhow to solve itProbability of event after x hours is 0.74e-0.5x + 0.25e-0.25x Find mean, variance and quartiles of waiting timesThe ---------- of disease represents the rate of occurrence of new cases arising in each period in a specified population.
- Gini coefficient is a statistic used to measure income inequality within nations. It ranges from 0 to 100, with higher scores indicating more inequality. At the extremes, a Gini score of 0 would mean that everyone in the country earns the exact same income, and a Gini score of 100 would mean that only one person in the country earns all the income. Some people argue that the larger a nation is, the more difficult it is to maintain a fair distribution of incomes. In other words, does income inequality increase as population size increases? You can test this question by conducting a bivariate regression on the data in the table below. Throughout calculating, and for the final answer, round to two decimals. ***Must show work on PDF for completing this computational table and for the following 9 questions*** Country (1) X: Population (in millions) (2) Y: Gini Score (3) (4) (5) (6) (7) Sweden 8 27 Ethiopia 77 29…Gini coefficient is a statistic used to measure income inequality within nations. It ranges from 0 to 100, with higher scores indicating more inequality. At the extremes, a Gini score of 0 would mean that everyone in the country earns the exact same income, and a Gini score of 100 would mean that only one person in the country earns all the income. Some people argue that the larger a nation is, the more difficult it is to maintain a fair distribution of incomes. In other words, does income inequality increase as population size increases? You can test this question by conducting a bivariate regression on the data in the table below. Throughout calculating, and for the final answer, round to two decimals. Country (1) X: Population (in millions) (2) Y: Gini Score (3) (4) (5) (6) (7) Sweden 8 27 Ethiopia 77 29 Switzerland 14 43 Laos 6 45 UK 58 35…Gini coefficient is a statistic used to measure income inequality within nations. It ranges from 0 to 100, with higher scores indicating more inequality. At the extremes, a Gini score of 0 would mean that everyone in the country earns the exact same income, and a Gini score of 100 would mean that only one person in the country earns all the income. Some people argue that the larger a nation is, the more difficult it is to maintain a fair distribution of incomes. In other words, does income inequality increase as population size increases? You can test this question by conducting a bivariate regression on the data in the table below. Throughout calculating, and for the final answer, round to two decimals. Country (1) X: Population (in millions) (2) Y: Gini Score (3) (4) (5) (6) (7) Sweden 8 27 Ethiopia 77 29 Switzerland 14 43 Laos 6 45 UK 58 35…
- 10) Integrated circuits consist of electric channels that are etched onto silicon wafers. A certain proportion of circuits are defective because of "undercutting", which occurs when too much material is etched away so that the channels, which consist of the unetched portions of the wafers, are too narrow. A redesigned process, involving lower pressure in the etching chamber, is being investigated. The goal is to reduce the rate of undercutting to less than 5%. Out of the first 1000 circuits manufactured by the new process, only 32 show evidence of undercutting. If someone asks you the question "Can you conclude that the goal has been met?", what is the p-value that you'll report? Round the answer to four decimal places.Gini coefficient is a statistic used to measure income inequality within nations. It ranges from 0 to 100, with higher scores indicating more inequality. At the extremes, a Gini score of 0would mean that everyone in the country earns the exact same income, and a Gini score of 100 would mean that only one person in the country earns all the income. Some people argue that the larger a nation is, the more difficult it is to maintain a fair distribution of incomes. In other words, does income inequality increase as population size increases? You can test this question by conducting a bivariate regression on the data in the table below. Throughout calculating, and for the final answer, round to two decimals. ***Must show work on PDF for completing this computational table and for the following 9 questions*** Country (1) X: Population (in millions) (2) Y: Gini Score (3) (4) (5) (6) (7) Sweden 8 27 Ethiopia 77 29…Chance errors are errors related to the variability in repeated measurements and change from measurement to measurement, sometimes up and sometimes down.True or false: If we increase the number of measurements taken, the long-run average of repeated measurements should give the exact value of the thing being measured. True: Chance errors and bias can both be reduced by increasing the number of measurements taken. True: Assuming there is no bias in the measurement procedure, the chance errors should cancel out. False: Chance errors can only be reduced by carefully selecting the measurements that are not outliers. False: Chance errors are inevitable and cannot be reduced no matter how many samples are taken.


