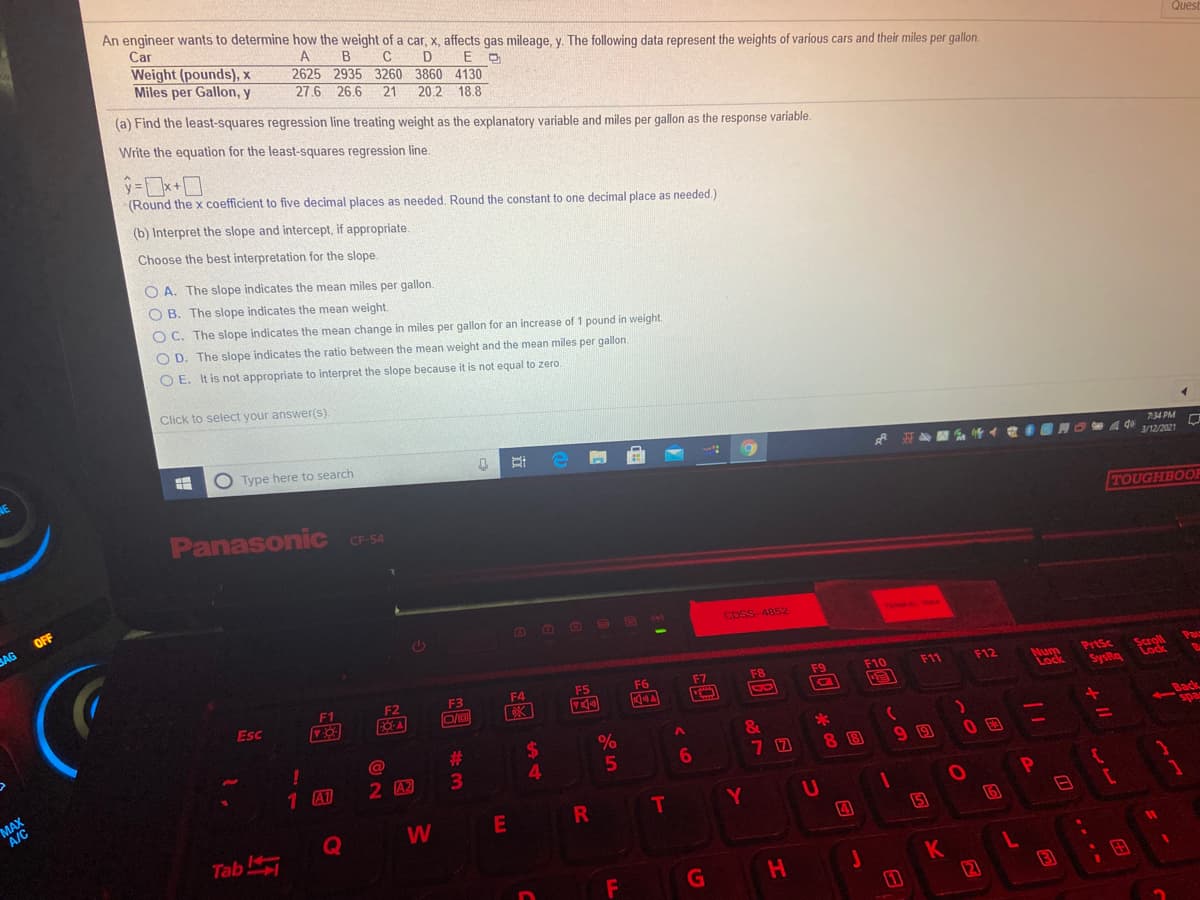
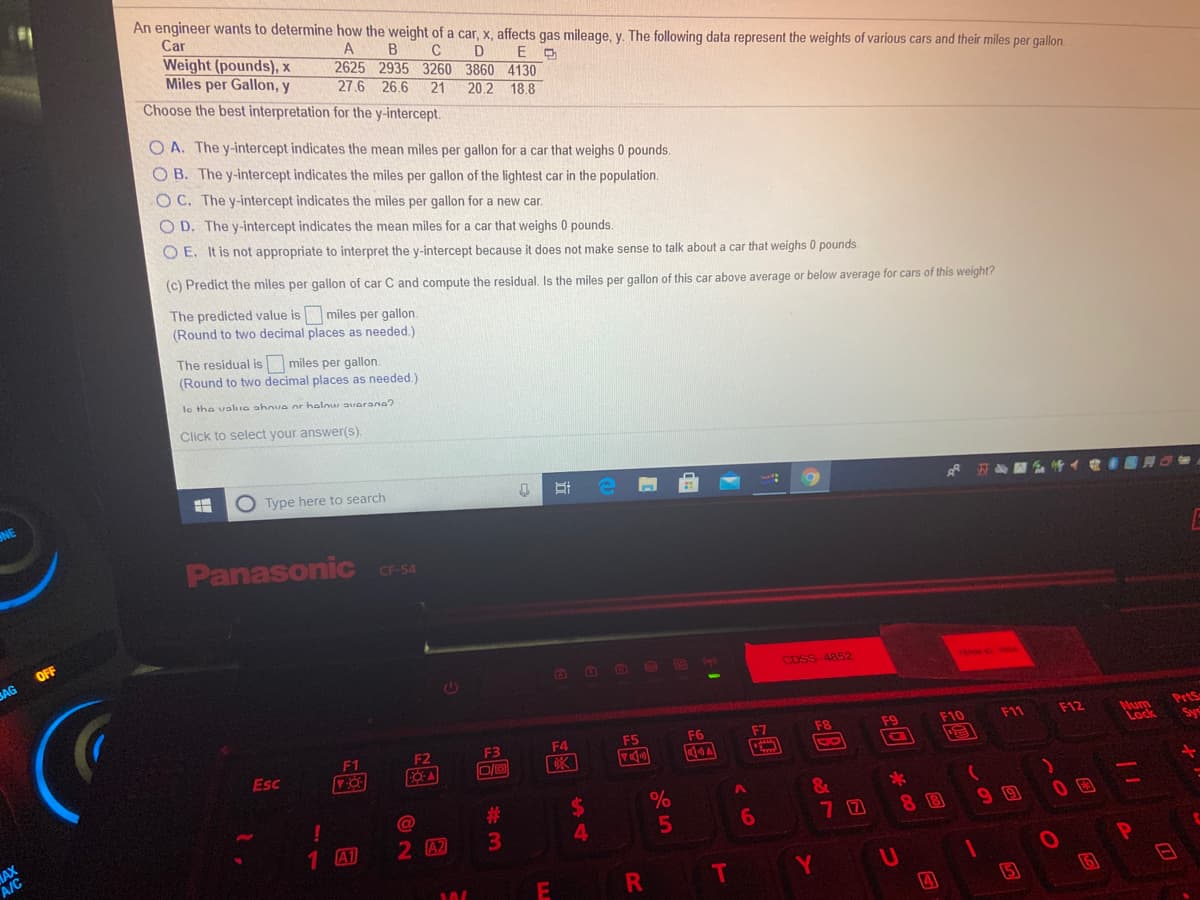
An engineer wants to determine how the weight of a car, x, affects gas mileage, y. The following data represent the weights of various cars and their miles per gallon. Car B 2625 2935 3260 3860 4130 27.6 26.6 21 D Weight (pounds), X Miles per Gallon, y 20.2 18.8 (a) Find the least-squares regression line treating weight as the explanatory variable and miles per gallon as the response variable. Write the equation for the least-squares regression line. (Round the x coefficient to five decimal places as needed. Round the constant to one decimal place as needed.) (b) Interpret the slope and intercept, if appropriate. Choose the best interpretation for the slope. O A. The slope indicates the mean miles per gallon. O B. The slope indicates the mean weight O C. The slope indicates the mean change in miles per gallon for an increase of 1 pound in weight. O D. The slope indicates the ratio between the mean weight and the mean miles per gallon O E. It is not appropriate to interpret the slope because it is not equal to zero. Click to select your answer(s)


Correlation
Correlation defines a relationship between two independent variables. It tells the degree to which variables move in relation to each other. When two sets of data are related to each other, there is a correlation between them.
Linear Correlation
A correlation is used to determine the relationships between numerical and categorical variables. In other words, it is an indicator of how things are connected to one another. The correlation analysis is the study of how variables are related.
Regression Analysis
Regression analysis is a statistical method in which it estimates the relationship between a dependent variable and one or more independent variable. In simple terms dependent variable is called as outcome variable and independent variable is called as predictors. Regression analysis is one of the methods to find the trends in data. The independent variable used in Regression analysis is named Predictor variable. It offers data of an associated dependent variable regarding a particular outcome.


Trending now
This is a popular solution!

Step by step
Solved in 2 steps with 3 images


