An environmental scientist developed a new analytical method for the determination of cadmium (Cd+) in mussels. To validate the method, the researcher measured the Cd concentration in standard reference material (SRM) 2976 that is known to contain 0.82 + 0.16 ppm Cd4. Five replicate measurements of the SRM were obtained using the new method, giving values of 0.787, 0.758, 0.824, 0.838, and 0.765 ppm Cd. Calculate the mean (x), standard deviation (s,), and the 95% confidence interval. A list of r values can be found in the Student's / table. ppm Ppm 95% confidence interval: ppm Does the new method give a tresult that differs from the known result of the SRM at the 95% confidence level? no yes
An environmental scientist developed a new analytical method for the determination of cadmium (Cd+) in mussels. To validate the method, the researcher measured the Cd concentration in standard reference material (SRM) 2976 that is known to contain 0.82 + 0.16 ppm Cd4. Five replicate measurements of the SRM were obtained using the new method, giving values of 0.787, 0.758, 0.824, 0.838, and 0.765 ppm Cd. Calculate the mean (x), standard deviation (s,), and the 95% confidence interval. A list of r values can be found in the Student's / table. ppm Ppm 95% confidence interval: ppm Does the new method give a tresult that differs from the known result of the SRM at the 95% confidence level? no yes

MATLAB: An Introduction with Applications
6th Edition
ISBN:9781119256830
Author:Amos Gilat
Publisher:Amos Gilat
Chapter1: Starting With Matlab
Section: Chapter Questions
Problem 1P

Related questions
Question
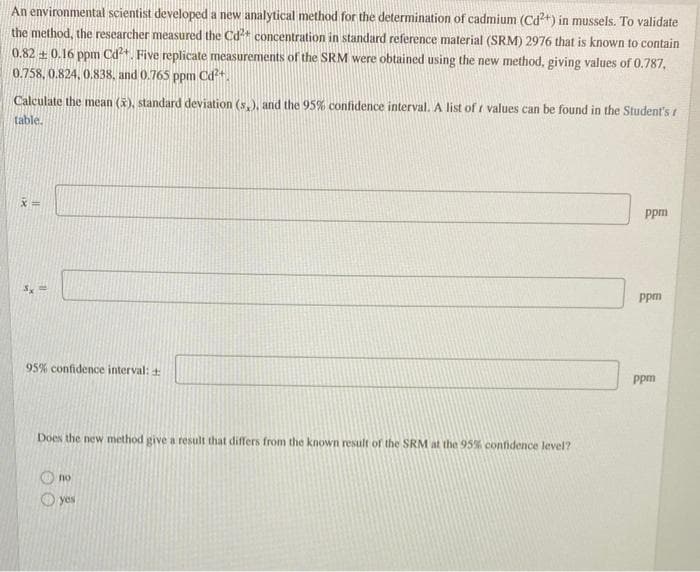
Transcribed Image Text:An environmental scientist developed a new analytical method for the determination of cadmium (Cd+) in mussels. To validate
the method, the researcher measured the Cdt concentration in standard reference material (SRM) 2976 that is known to contain
0.82 + 0.16 ppm Cd+. Five replicate measurements of the SRM were obtained using the new method, giving values of 0.787,
0.758, 0.824, 0.838, and 0.765
ppm
Calculate the mean (x), standard deviation (s,), and the 95% confidence interval. A list of i values can be found in the Student's
table.
X3=
Ppm
Ppm
95% confidence interval: +
Ppm
Does the new method give a result that differs from the known result of the SRM at the 95% confidence level?
no
yes
Expert Solution
This question has been solved!
Explore an expertly crafted, step-by-step solution for a thorough understanding of key concepts.

Step by step
Solved in 3 steps with 2 images

Recommended textbooks for you
MATLAB: An Introduction with Applications
Statistics
ISBN:
9781119256830
Author:
Amos Gilat
Publisher:
John Wiley & Sons Inc

Probability and Statistics for Engineering and th…
Statistics
ISBN:
9781305251809
Author:
Jay L. Devore
Publisher:
Cengage Learning

Statistics for The Behavioral Sciences (MindTap C…
Statistics
ISBN:
9781305504912
Author:
Frederick J Gravetter, Larry B. Wallnau
Publisher:
Cengage Learning
MATLAB: An Introduction with Applications
Statistics
ISBN:
9781119256830
Author:
Amos Gilat
Publisher:
John Wiley & Sons Inc
Probability and Statistics for Engineering and th…
Statistics
ISBN:
9781305251809
Author:
Jay L. Devore
Publisher:
Cengage Learning
Statistics for The Behavioral Sciences (MindTap C…
Statistics
ISBN:
9781305504912
Author:
Frederick J Gravetter, Larry B. Wallnau
Publisher:
Cengage Learning

Elementary Statistics: Picturing the World (7th E…
Statistics
ISBN:
9780134683416
Author:
Ron Larson, Betsy Farber
Publisher:
PEARSON

The Basic Practice of Statistics
Statistics
ISBN:
9781319042578
Author:
David S. Moore, William I. Notz, Michael A. Fligner
Publisher:
W. H. Freeman

Introduction to the Practice of Statistics
Statistics
ISBN:
9781319013387
Author:
David S. Moore, George P. McCabe, Bruce A. Craig
Publisher:
W. H. Freeman