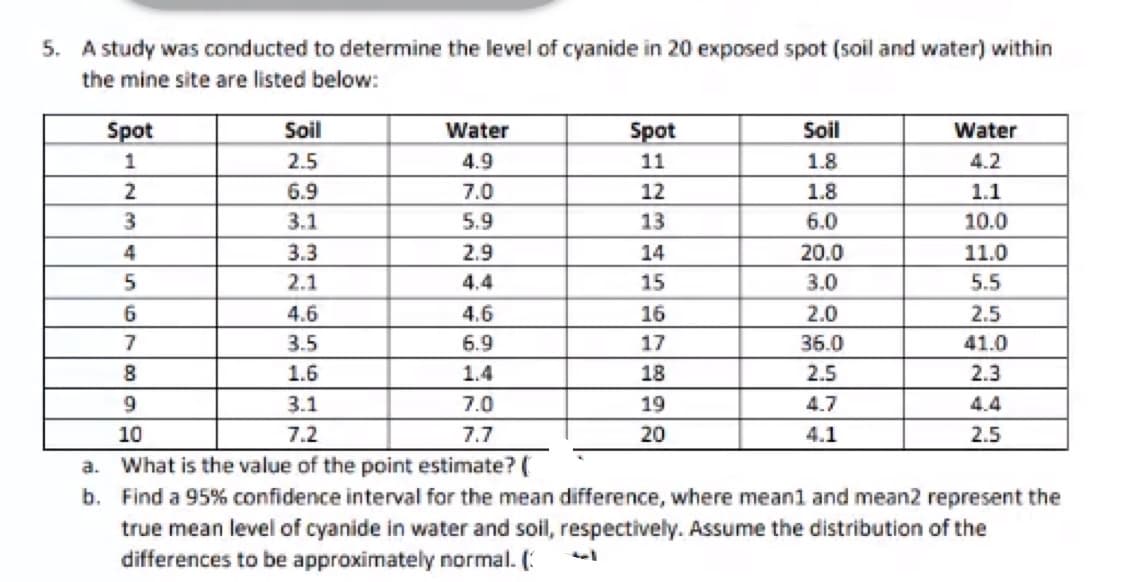
.A study was conducted to determine the level of cyanide in 20 exposed spot (soil and water) within the mine site are listed below: Spot Soil Water Spot Soil Water 1 2.5 4.9 11 1.8 4.2 2 6.9 7.0 12 1.8 1.1 3.1 5.9 13 6.0 10.0 4 3.3 2.9 14 20.0 11.0 2.1 4.4 15 3.0 5.5


Q: 2. A study was conducted to determine the level of cyanide in 20 exposed spot (soil and water)…
A: Given :
Q: 2 6. Investigate the association between eye colour of husbands and eye colour of wives from the…
A:
Q: 2. The absorbance measurement rates of three equivalent spectrophotometers used in an analysis…
A: We have used the excel data analysis tool to run the ANOVA analysis.
Q: A sample of 10 test coupons from two companies, reveals the titanium content in an aircraft- grade…
A:
Q: Listed below, along with some summary statistics, are amounts of strontium-90 (in millibecquerels…
A: The data is collected from the same group of subjects consecutively for two years. Therefore both…
Q: A suwey paoject was Undertaken by the sludents of MSC - Statistics in Small village Rnjab havèng…
A: The given details: Expenditure on milk: 60, 85, 80,106, 60, 84, 45, 106, 75, 102, 75, 60, 60, 108,…
Q: Suppose samples of soil around homes in an area were obtained and the lead level in each was…
A: Empirical rule: The Empirical Rule states that 99.7% of data observed following a normal…
Q: A study measures the sorption rate of three different types of organic chemical solvents. These…
A: Given data : Aromatics chloroalkenes Esters 1.06 1.58 0.29 0.79 1.45 0.06 0.82 0.57 0.44…
Q: Consider the following ANOVA table: Source of Variation SS df MS F Treatments 4 2…
A: Solution treatment refers to a level of the independent variable included in the model.
Q: The following data was reported on total Fe for four types of iron formation (1 = carbonate, 2 =…
A: By using excel we can solve this question easily. First, enter all data into excel. Click on Data…
Q: A study measures the sorption rate of three different types of organic chemical solvents. These…
A: Given :
Q: A paper gave summary quantities for blood lead level (in micrograms per deciliter) for a sample of…
A: Calculate the Sample mean using general formula.................................
Q: The following table was presented in a article summarizing a study to compare a new drug to a…
A: Given: The table presented in a article summarizing a study to compare a new drug to a standard drug…
Q: The data below are from an independent-measures experiment comparing three different treatment…
A: Given Number of treatment 3 Number of observation 12
Q: In order to determine whether the significant difference in the durability of 3makes of computers,…
A: For the given data, ANOVA will be used: Given data set: A B C 5 8 7 6 10 3 8 11 5 9 12 4…
Q: Listed below are body temperatures from five different subjects measured at 8 AM and again at 12 AM.…
A: Given observation and calculation is shown below
Q: The number of contaminating particles on a silicon waferprior to a certain rinsing process was…
A:
Q: An article in the Journal of Environmental Engineering reported the results of a study on the…
A: The dependent variable is chloride concentration. The independent variable is watershed. This is…
Q: 29. Calculate mode from the following data of the number of children in different families in…
A:
Q: 1. Using the above data we obtain the following descriptive statistics Deaths PCRTests Admissions…
A: As per guidelines, we will only answer first three subparts. a) Daily mean deaths in the UK over…
Q: The following are quality control data for a manufacturing process at Kensport Chemical Company. The…
A: The given data set: Sample X R 1 95.72 1.0 2 95.24 0.9 3 95.18 0.9…
Q: The following data vwas reported on total Fe for four types of iron formation (1 = carbonate, 2 =…
A: Consider that, µ1, µ2, µ4 and µ4 define the true mean amount of Fe for carbonate (1), silicate (2),…
Q: In an attempt to measure the effects of acid rain, researchers measured the pH (7 is neutral and…
A:
Q: The following are quality control data for a manufacturing process at Kensport Chemical Company. The…
A: Given information- We have given the quality control data for a manufacturing process at Kensport…
Q: 2. A study was conducted to determine the level of cyanide in 20 exposed spot (soil and water)…
A: Since you have posted a question with multiple sub-parts, we will solve first three sub-parts for…
Q: concentration differs among the three days? Use the =α0.05 level of significance and the ANOVA…
A:
Q: a) A tube of toothpaste is set to be automatically filled to 6.35 ounces. Every four hours 4 tubes…
A: Since you have posted a question with multiple sub-parts, we will solve the first three sub-parts…
Q: The data below are from an independent-measures experiment comparing three different treatment…
A: Given Treatment 1 Treatment 2 Treatment 3 0 1 4 0 4 3 0 1 6 2 0 3
Q: Let x be the percentage of 16- to 19-year-olds not in school and not high school graduates. Let y be…
A: Note- Hey there! As per our policy we can answer only the first 3 sub-parts of a question. Please…
Q: Rose Orchid Lavender 77 72 76 81 58 85 71 74 82 76 66 80 80 70 77 Total Sample mean 385 340 400 77…
A: AVOVA one way classification is a type of statistical test that compares the variance in the group…
Q: Listed below are body temperatures from five different subjects measured at 8 AM and again at 12 AM.…
A: Listed below are body temperatures from five different subjects measured at 8 AM and again at 12 AM.…
Q: Complete the following table to compare men and women using data collected at the first examination…
A: Given:
Q: Conduct a hypothesis test using an alpha level of α = .01 to determine if the correlation is…
A: Given that the correlation between Job satisfaction and work-life balance is given by r = 0.69…
Q: An article in Environment International (Vol. 18, No. 4, 1992) describes an experiment in which the…
A:
Q: The concentration level of Zinc in milligrams in two types of soil was found to be as follows Soil…
A: From the given information, Sample data can be shown below: A B 2.1 0.6 4 3.1…
Q: 5. A study was conducted to determine the level of cyanide in 20 exposed spot (s the mine site are…
A: For Water : sample size (n1) = 20sample mean (x̄1) = Σx1 /n1 =…
Q: The following data were taken from a research article in the Canadian Journal of Fisheries and…
A: 1. The null and alternative hypothesis is given by, H0:μ1-μ2=0Ha:μ1-μ2≠0 2. The sample for LSL is 10…
Q: Listed below are body temperatures from five different subjects measured at 8 AM and again at 12 AM.…
A: Mean is the measure of central tendency. It is calculated by adding all the values and divided by…
Q: Given are data on average food consumption (g / kg body wt) of groups of tilapia , Oreochromis…
A: Whenever we want to study the difference between the average values of same subject…
Q: The following are quality control data for a manufacturing process at Kensport Chemical Company. The…
A: Given information- We have given the quality control data for a manufacturing process at Kensport…
Q: Penicillin is produced by the Penicillium fungus, which is grown in a broth whose sugar content must…
A:
Q: Department of Research and Development of Unilever Sdn Bhd has condi study to improve the quality of…
A: Given: n = 50
Q: 1. A researcher would like to compare the acidity level of five brands of yogurt that being sold in…
A: Note: As per guidelines we will solve the first question only, please repost other questions for…
Q: Suppose samples of soil around homes in an area were obtained and the lead level in each was…
A:
Q: Penicillin is produced by the Penicillium fungus, which is grown in a broth whose sugar content must…
A: Since you have posted a question with multiple sub-parts, we will solve first three subparts for…
Q: 10 The following table shows the frequency distribution of the number of children at a childcare…
A:
Q: Following are measurements of soil concentrations (in mg/kg) of chromium (Cr) and nickel (Ni) at 20…
A: a. The data shows the measurement of soil concentrations (in mg/kg) of chromium (Cr) and nickel (Ni)…
Q: Analysis of several plant-food preparations for potassium ion yielded the following data: Sample…
A: b. Use the DEVSQ( ) function to find the sum of squares of the deviations for each sample, then the…
Q: Activity 19 number 4 &5
A: 4. In the following table, we have stored the data on the number of orange candies, and total number…
Q: The following are quality control data for a manufacturing process at Kensport Chemical Company. The…
A: Quality is essential in all fields. Studying the quality using a statistical method is called…

Step by step
Solved in 3 steps with 3 images

- Listed below are amounts of strontium-90 (in millibecquerel mBq) in a simple random sample of baby teeth. 128, 130, 133, 137, 138, 142, 142, 144, 147, 149, 151, 151, 151, 155, 156, 161, 163, 163, 166, 172 Construct a boxplot and identify the 5-number summary.If the C/PEL of 12 samples taken from the same spot in the factory were reported by a laboratory as follows 0.84,0.87,0.91,0.95,0.98,0.99,1.04,1.06,1.09,1.11,1.14,1.16 Calculate the CV of the above analytical data. Calculate the LDV5% and UDV5% values for your chemical.18. What is the significant level (in %)?
- To evaluate the coagulation effects of three drugs, 30 healthy volunteers were randomly assigned into 3 groups and injected with different drugs. Their relevant coagulation times were measured as follows A(group=1): 36.8 34.4 34.3 35.7 33.2 31.1 34.3 29.8 35.4 31.2B(group=2): 40.0 35.5 36.7 39.3 40.1 36.8 33.4 38.3 38.4 39.8C(group=3): 32.9 37.9 30.5 31.1 34.7 37.6 40.2 38.1 32.4 35.6Questions: ① If you want to evaluate whether the coagulation effects of the three drugs are different, which method should be used? and what are the model assumptionsfor the application of this method?② Compare the difference of the coagulation effects among three drugs by SPSS,present the main results and make interpretation.③ Make pairwise comparisons of the efficacy of the three drugs, write out the method of pairwise comparison you adopted (just write one method) and the corresponding p-values.The use of preservatives by food processors has become a controversial issue. Suppose 2 preservatives are extensively tested and determined safe for use in meats. A processor wants to compare the preservatives for their effects on retarding spoilage. Suppose 15 cuts of fresh meat are treated with preservative A and 15 are treated with preservative B and the number of hours until spoilage begins is recorded for each of the 30 cuts of meat. The results are summarized in the table below. Preservative Type Sample Size Sample Mean Sample Standard Deviation A 15 106.4 hours 10.3 hours B 15 96.54 hours 13.4 hours a. At 0.05 level of significance test if the population variances differ for preservatives A and B. b. Use the result in (a) to test if the population means differ for preservative A and B at 0.05 level of significance.Suppose that 3000 drivers in Wakanda were randomly breath-tested on 21 April 2019 and 116 were above the limit of 0.05 blood- alcohol level. On 15 May 2019, 4000 drivers were tested and 98 were above this level. 1.3.1 What additional information would you require before trying to draw conclusion from these data? (5) 1.3.2 What factors, other than a real change in driver behaviours, could cause such a drop in the proportion of above-the-limit drivers. (6) 1.4 A set of data has an interquartile range of 20 and a lower quartile of 6. If the data is symmetrical, calculate the value of the median.
- The Department of Natural Resources (DNR) received a complaint from recreational fishermen that a community was releasing sewage into the river where they fished. These types of releases lower the level of dissolved oxygen in the river and hence cause damage to the fish residing in the river. An inspector from the DNR designs a study to investigate the fishermen’s claim. Fifteen water samples are selected at locations on the river upstream from the community and fifteen samples are selected downstream from the community. The dissolved oxygen readings in parts per million (ppm) are given in the following table.Upstream 5.2 4.8 5.1 5.0 4.9 4.8 5.0 4.7 4.7 5.0 4.6 5.2 5.0 4.9 4.7, Downstream 3.2 3.4 3.7 3.9 3.6 3.8 3.9 3.6 4.1 3.3 4.5 3.7 3.9 3.8 3.7 a.In order for the discharge to have an impact on fish health, there needs to be at least a 0.5 ppm reduction in the dissolved oxygen. Do the data provide sufficient evidence that there is a large enough reduction in the mean dissolved oxygen…In the nation of Gondor, the EPA requires that half the new cars sold will meet a certain particulate emission standard a year later. A sample of 64 one-year-old cars revealed that only 20 met the particulate emission standard. What is the test statistic to see whether the proportion is below the requirement?Wertheretal et al. examined the β-leucocyte count (/ L) in 51subjects with colorectal cancer and 19 healthy controls. The cancer patients were also classified into Dukes’s classification (A,B,C) for colorectal cancer that gives doctors a guide to the risk, following surgery, of cancer coming back or spreading to other parts of the body. An additional category (D) identified patients with disease that had not been completely resected. The results are displayed in the following table. Perform an analysis of these data in which you identify the sources of variability and specify the degrees of freedom for each. Do these data provide sufficient evidence to indicate that, on average, leucocyte counts differ among the five categories? Let α=0.01 . Write the null and alternative hypotheses of this study. Test the claim using the ANOVA Table. If you reject the null hypothesis, interpret your results using multiple comparison test Bonferroni. What assumptions must be made in part (b)? Are they…
- Suppose a researcher is interested in the relationship between periodontal disease and a number of negative health outcomes. One outcome of particular interest to the researcher is hypertension (assume defined as systolic blood pressure above 140 mmHG). Suppose a team gathers a SRS of 348 participants with periodontal disease, and finds the sample average systolic blood pressure to be 157 mmHG. A) Using an assumed σ=16 mmHG, conduct a 1 sample Z test to determine if there is a relationship between periodontal disease and hypertension in this population. (Use α=0.05)Suppose that in the previous semester, the percentages of students in the five sections of ECO 204 were 20%, 21%, 19%, 15% and 25%. However, in the current semester, among a sample of 200 students, the student distribution among five sections is 51, 49, 30, 20 and 50. Can we conclude that there has been a statistically significant change in the student proportions?The number of contaminating particles on a silicon waferprior to a certain rinsing process was determined for eachwafer in a sample of size 100, resulting in the followingfrequencies:Number of particles 0 1 2 3 4 5 6 7Frequency 1 2 3 12 11 15 18 10Number of particles 8 9 10 11 12 13 14Frequency 12 4 5 3 1 2 1a. What proportion of the sampled wafers had at leastone particle? At least five particles?b. What proportion of the sampled wafers had betweenfive and ten particles, inclusive? Strictly between fiveand ten particles?c. Draw a histogram using relative frequency on thevertical axis. How would you describe the shape of thehistogram?
