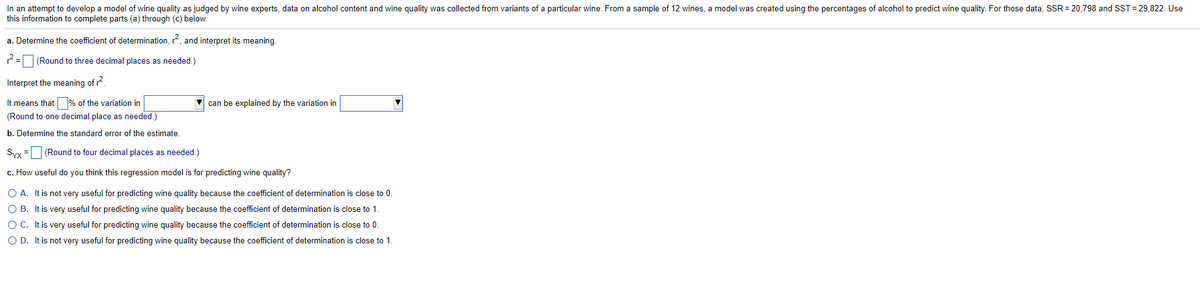
In an attempt to develop a model of wine quality as judged by wine experts, data on alcohol content and wine quality was collected from variants of a particular wine. From a sample of 12 wines, a model was created using the percentages of alcohol to predict wine quality. For those data, SSR = 20,798 and SST = 29,822. Use this information to complete parts (a) through (c) below. a. Determine the coefficient of determination, , and interpret its meaning 2= (Round to three decimal places as needed.) Interpret the meaning of r. It means that% of the variation in (Round to one decimal place as needed) V can be explained by the variation in b. Determine the standard error of the estimate. Sx (Round to four decimal places as needed.) c. How useful do you think this regression model is for predicting wine quality? O A. It is not very useful for predicting wine quality because the coefficient of determination is close to 0. OB. It is very useful for predicting wine quality because the coefficient of determination is close to 1. OC. t is very useful for predicting wine quality because the coefficient of determination is close to 0. OD. Ris not very useful for predicting wine quality because the coefficient of determination is close to 1.


Correlation
Correlation defines a relationship between two independent variables. It tells the degree to which variables move in relation to each other. When two sets of data are related to each other, there is a correlation between them.
Linear Correlation
A correlation is used to determine the relationships between numerical and categorical variables. In other words, it is an indicator of how things are connected to one another. The correlation analysis is the study of how variables are related.
Regression Analysis
Regression analysis is a statistical method in which it estimates the relationship between a dependent variable and one or more independent variable. In simple terms dependent variable is called as outcome variable and independent variable is called as predictors. Regression analysis is one of the methods to find the trends in data. The independent variable used in Regression analysis is named Predictor variable. It offers data of an associated dependent variable regarding a particular outcome.


Trending now
This is a popular solution!

Step by step
Solved in 2 steps


