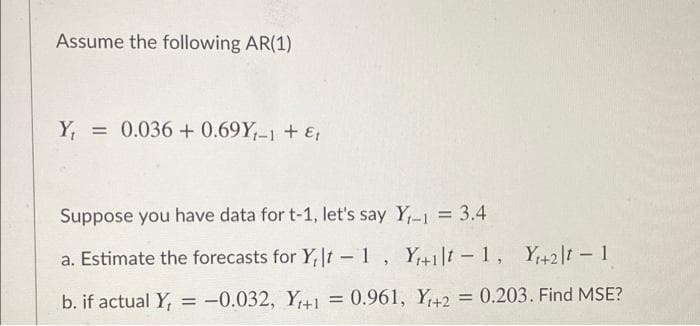
Assume the following AR(1) Y, = 0.036 + 0.69Y,-1 + E Suppose you have data for t-1, let's say Y,I = 3.4 %D a. Estimate the forecasts for Y,t -1, Y+1]t -1, Y+2|t - 1 b. if actual Y, = -0.032, Y+1 = 0.961, Y42 = 0.203. Find MSE?


Q: The probability distribution for damage claims paid by the Newton Automobile Insurance Company on…
A: Given: To Find: The expected value of an insurance claim for this company
Q: The use of quarterly data to develop the forecasting model Yt = a +bYt-1 is an example of which…
A: The forecasting refers to the prediction technique for a certain situation taking into consideration…
Q: Comprehensively state the criteria and process of selecting appropriate models for time series…
A: Time series forecasting is used when making scientific forecasts based on historical time stamped…
Q: 10. chronological order: 5, 10,-10, 0, 10. Which of the following statements is (are) true? Here are…
A: Economics is a branch of social science that describes and analyzes the behaviors and decisions…
Q: Jan '20 0.68 Feb '20 0.76 Mar '20 1.6 Apr '20 1.47 May '20 0.98 Jun '20 1.18 Jul '20 3.59 Aug '20…
A: 1) Simple Moving Average (SMA): A simple moving average is a statistical tool that simply calculates…
Q: Actual sales of TV's for the first six month in 2021 were as follows: January 60…
A: A simple moving average (SMA) calculates the average of a selected range of prices, usually closing…
Q: Short-range forecasts tend to ________ longer-range forecasts. A. deal with more comprehensive…
A: Forecasts for the short term are made using data that has been seen, extrapolated, and how systems…
Q: Compute the expected return given these three economic states, their likelihoods, and the potential…
A: The expected return on a financial investment is the expected value of its return. It is a measure…
Q: temperature. (ii) Predict the electricity consumption of the office when the maximum temperature is…
A: Regression is a measurable technique utilized in money, contributing, and different disciplines that…
Q: Campus Advising needs to allocate time this week for office appointments, so she needs te forecast…
A: Economics is a branch of social science that describes and analyzes the behaviors and decisions…
Q: HOTELLING MODEL Consider a market in which today’s crude oil price is $100/bbl, and the marginal…
A: Answer in Step 2
Q: Covid-19 backed by Lockdown generated many economic anomalies. The weekly change in the price of the…
A: Since you have asked a question with multiple sub-parts, we will solve the first three sub-parts for…
Q: or all parts of this question, assume that the log of GDP per capita is normally distributed with a…
A: Given Mean of log GDP per capita =8.7 Standard deviation =1.5 We have to calculate the value of…
Q: Name two coincident indicators used in forecasting
A: Coincident indicators help in understanding the current economic position prevailing in a particular…
Q: Part C 3. The manager of a certain gasoline station wants to forecast the demand for the unleaded…
A: Exponential smoothed forecast for demand from April to November when α = 0.25 Exponential smoothed…
Q: Choose one of the following forecasting methods discussed in this chapter: last-value, averaging,…
A: Exponential smoothing is commonly used to make short term forecasts, yet longer-term estimates…
Q: What should the value of alpha be in anexponential smoothing forecast to be very responsive to…
A: Demand is quantity that the consumers are willing to purchase at various different prices.
Q: Identify and briefly describe the two general forecasting approaches.
A: Qualitative forecasting is predicated on information that cannot be measured. It's especially…
Q: A local moving company has collected data on the number of moves they have been asked to perform…
A: The equation for the trend line of yearly sales is given: Ft = 16 + 60t
Q: (age), number of room in a house (room), and the natural logarithm of the distance from a house to…
A: A2. The correct answer is option a. A one percent increase in distance decreases the housing price…
Q: Consider the following estimated model Ipassen 8.26-0.6131fare +0.142 ldist, (0.078) (0.040)…
A: We have regression model where dependent variable is regressed on independent variables.
Q: ber of tons of brake assemblies received at an auto parts distribution center last month wa ast…
A: Given that,
Q: Consider the following time series data: Month 1 2 3 4 5 6 7 Value 24 13 20 12 19 23…
A: MSE stands for Mean squared error. It calculates the average squared difference between the forecast…
Q: A police station had to deploy a police officer for an emergency multiple times in the last four…
A: Forecast for Friday using naive approach = Actual demand of previous period(Thursday) = 12.
Q: Question 4 Consider the following data: Month Bicycles Sold 21.6 2. 22.9 25.5 21.9 23.9 6. 27.5 7…
A: We are going to calculate Mean Absolute Percentage Error using its formula and definition.
Q: EXPLAIN 2 ways of how should the decision maker incorporate forecast error?
A: A forecast error is simply the difference between the actual and forecasted value of any time series…
Q: Director Very Busy needs to allocate time this week for office appointments, so he needs to forecast…
A: Economics is a branch of social science that describes and analyzes the behaviors and decisions…
Q: 3. Report the sample mean and standard deviationof the 52-week cost under each policy. Usingthe…
A: Given
Q: If R2 = 1, it means that all of your errors are large O your model is no better at predicting Y than…
A: The R square is a statistical measurement that looks at how variations in one variable may be…
Q: Here are the errors associated with a particular forecast over the past five months, in…
A: Economics is a branch of social science that describes and analyzes the behaviors and decisions…
Q: Silicon Co. has forecasted the Canadian dollar for the most recent period to be $0.73. The realized…
A: Absolute forecast error means the difference between forecasted and actual value of the currency ,…
Q: The Global Machine Manufacturing Company, Q5. manufacturing Heavy Machines in the Sultanate of Oman.…
A: Disclaimer :- as you posted Multipart questions we are supposed to solve the first 3 questions only.…
Q: The quadrant on which IS and LM are plotted is known as IY space? true or false
A: IS line shows the goods market equilibrium and it is downward sloping curve which shows Inverse…
Q: Next Stândard Period Error Forecasting Method Used Forecast (MSE) 1.3-period UnWMA 10.42 3.24…
A: Given:
Q: c. What would be this week's forecast for employee appointments using exponential smoothing with…
A: Economics is a branch of social science that describes and analyzes the behaviors and decisions…
Q: The type of economic indicator that can best be used for business forecasting is the:
A: The periodic and irregular increases and decreases of an economy's real GDP, employment level, and…
Q: Define Forecasts and forecast errors in time series anaylsis?
A: Time series analysis is a technique in statistics that deals with trend analysis or time series…
Q: Suppose we have the following time series data on variable Y (where t = trend): t Y 1 100 2 120 3…
A: Given: t y (At) 1 100 2 120 3 160 4 200 α=0.5
Q: a) Forecast the company's market share for the 13th quarter by exponential smoothing with w=0.3.
A: Since you have asked multiple questions, we will solve the first question for you. If you want any…
Q: Director Very Busy needs to allocate time this week for office appointments, so he needs to forecast…
A: Economics is a branch of social science that describes and analyzes the behaviors and decisions…
Q: The forecast for week 13 is (Enter your response rounded to the nearest whole number)
A: After finding the regression equation we use the value 13 in the independent variable to forecast…
Q: How Forecasts is compared with predicted values? why these both terms are different?
A: A forecast is an estimation that is based on the previous data. A prediction is estimating the…
Q: Calculate the expected mean for this equation, while u = 0.a ; $1 = 0.0a Yt = u+ P1yt-1+Ut
A: here we calculate the given by following method.
Q: For each of the following situations, find the critical value(s) for z or t. a) Ho. p=0.6 vs. HA p…
A: A) the test is two tailed. Alpha is 0.05 So the critical value becomes +1.96 and -1.96
Q: 12- Which of the following is true in case of measurement error in the regressor? a) Predictors are…
A: The variables which are used to predict the dependent variable or an outcome.
Q: The ife of button battenies is normaly distributed with a mean of 68.1 hours and a standard how many…
A: the standard deviation is a measure of the amount of variation or dispersion of a set of values…
8

Step by step
Solved in 3 steps with 3 images


- Consider the following time series data: Month 1 2 3 4 5 6 7 Value 24 13 20 12 19 23 15 Compute MSE using the most recent value as the forecast for the next period. What is the forecast for month 8? Compute MSE using the average of all the data available as the forecast for the next period. What is the forecast for month 8? Which method appears to provide the better forecast?Savings-Mart (a chain of discount department stores) sells patio and lawn furniture. Sales are seasonal, with higher sales during the spring and summer quarters and lower sales during the fall and winter quarters. The company developed the following quarterly sales forecasting model: Y t=8.25+0.125t2.75D1t+3.50D3t where Y t=predictedsales(million)inquartert 8.25=quarterlysales(million)whent=0 t=timeperiod(quarter)wherethefourthquarterof2002=0,firstquarterof2003=1,secondquarterof2003=2,... D1t={1forfirst-quarterobservations0otherwiseD2t={1forsecond-quarterobservations0otherwiseD3t={1forthird-quarterobservations0otherwise Forecast Savings-Marts sales of patio and lawn furniture for each quarter of 2010.The following is the data of recent refrigerator sales at a local Home Depot store. Month 1 2 3 4 5Actual Sales 95 100 80 90 ???Inputs will be exact numbers. What is the forecasted sales in month 5 using naive approach.Please use a 2-month simple moving average method to forecast sales in month 5.Please use a weighted moving average method, with weights of 0.6 one period ago, 0.3 two periods ago, and 0.1 three periods ago, to forecast sales in month 5.
- Based on annual data from 2000-2010, the Gadget Company estimates that sales are growing according to a linear trend: Q = 50,000 + 200t where t is time and t = 0 in 2000. a. Forecast sales for 2013. b. Do you see any problems with this forecasting method?Identify and briefly describe the two general forecasting approaches.Q6 Suppose that at time t=0, half of a "logistic" population of 100000 persons have heard a certain rumor and that the number of those who have heard it is then increasing at the rate of 500 persons per day. How long will it take for this rumor to spread to 80% of the population? ( Suggestion: Find the value of k by substituting P(0) and P'(0) in the logistic equation) a. About 98 days b. About 34 days c. About 19 days d. About 69 days e. About 119 days
- How Forecasts is compared with predicted values? why these both terms are different?Jan '20 0.68 Feb '20 0.76 Mar '20 1.6 Apr '20 1.47 May '20 0.98 Jun '20 1.18 Jul '20 3.59 Aug '20 3.33 Sept '20 4.31 Oct '20 3.84 Nov '20 6.97 Dec '20 7.7 Using data above please provide one qualitative and two quantitative (Simple and weighted moving average) monthly forecasts in the United States for the holiday season in 2021a. In the Bayside Fountain Hotel problem, compute an exponentially smoothed forecast with an α value of .20. According to the result from Excel and/or POM-QM, the forecast for the year 10 would be b. In the Bayside Fountain Hotel problem, for the exponentially smoothed forecast with an α value of .20, compute the mean absolute deviation (MAD) via Excel and/or POM-QM. c. In the Bayside Fountain Hotel problem, compute an adjusted exponentially smoothed forecast with α = .20and β = .20. According to the result from Excel and/or POM-QM, the forecast for the year 4 would be d.
- A researcher has a sample of 6 annual observations {94, 104, 102, 99, 111 and 107} for the CPI in country Z for the period 2015 to 2020, and wants to forecast CPI for the years 2021, 2022 and 2023. The researcher uses 3 different forecasting models: A, B and C. Model A is an AR(1) model with no drift and with an estimated autoregressive coefficient = 0.7. Model B is a MA(1) model with no constant and with an estimated MA coefficient = -0.4 (note the minus !). Model C is a random walk model with no drift. The error terms over the 2015-2020 period were estimated to have the values: {3, -1, 2, 4, -3, 1}. a. Compute the 2021, 2022 and 2023 forecasted values for the consumer price index based on the three models. Show the formulas and the details of your calculations, and explain all the related symbols. b. Suppose that the actual values of the CPI over the 2021, 2022 and 2023 were {108, 114, 105}. Calculate the Root mean square error of the three model forecasts over the 2021-2023…A firm experienced the demand shown in the following table. *Unkown future value to be forecast Fill in the table by preparing forecasts based on a five-year moving average, a three-year moving average, and exponential smoothing (with a w=0.9 and a w=0.3). Note The exponential smoothing forecasts may be begun by assuming Y t+1=Yt. Using the forecasts from 2005 through 2009, compare the accuracy of each of the forecasting methods based on the RMSE criterion. Which forecast would you have used for 2010? Why?Metropolitan Hospital has estimated its average monthly bed needs as N=1,000+9X where X=timeperiod(months);January2002=0 N=monthlybedneeds Assume that no new hospital additions are expected in the area in the foreseeable future. The following monthly seasonal adjustment factors have been estimated, using data from the past five years: Forecast Metropolitans bed demand for January, April, July, November, and December 2007. If the following actual and forecast values for June bed demands have been recorded, what seasonal adjustment factor would you recommend be used in making future June forecasts?