
Videos
Metropolitan Hospital has estimated its average monthly bed needs as
where
Assume that no new hospital additions are expected in the area in the foreseeable future. The following monthly seasonal adjustment factors have been estimated, using data from the past five years:
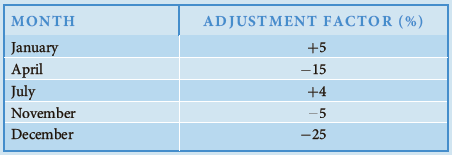
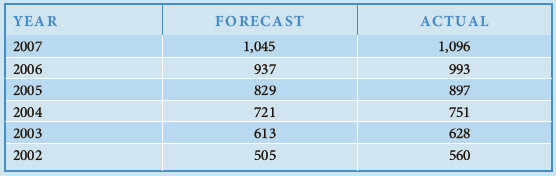
Forecast Metropolitan’s beddemand for January, April, July, November, and December 2007.- If the following actual and forecast values for June bed demands have been recorded, what seasonal adjustment factor would you recommend be used in making future June forecasts?

Trending nowThis is a popular solution!

Chapter 5 Solutions
Managerial Economics: Applications, Strategies and Tactics (MindTap Course List)


- The economic analysis division of Mapco Enterprises has estimated the demand function for its line of weed trimmers as QD=18,000+0.4N350PM+90Ps where N=numberofnewhomescompletedintheprimarymarketarea PM=priceoftheMapcotrimmerPS=priceofitscompetitorsSurefiretrimmer In 2010, 15,000 new homes are expected to be completed in the primary market area. Mapco plans to charge $50 for its trimmer. The Surefire trimmer is expected to sell for $55. What sales are forecasted for 2010 under these conditions? If its competitor cuts the price of the Surefire trimmer to $50, what effect will this have on Mapcos sales? What effect would a 30 percent reduction in the number of new homes completed have on Mapcos sales (ignore the impact of the price cut of the Surefire trimmer)?arrow_forwardThe Questor Corporation has experienced the following sales pattern over a 10-year period: Compute the equation of a trend line (similar to Equation 5.4) for these sales data to forecast sales for the next year. (Let 2004=0,2005=1, etc., for the time variable.) What does this equation forecast for sales in the year 2014? Use a first-order exponential smoothing model with a w of 0.9 to forecast sales for the year 2014.arrow_forwardSavings-Mart (a chain of discount department stores) sells patio and lawn furniture. Sales are seasonal, with higher sales during the spring and summer quarters and lower sales during the fall and winter quarters. The company developed the following quarterly sales forecasting model: Y t=8.25+0.125t2.75D1t+3.50D3t where Y t=predictedsales(million)inquartert 8.25=quarterlysales(million)whent=0 t=timeperiod(quarter)wherethefourthquarterof2002=0,firstquarterof2003=1,secondquarterof2003=2,... D1t={1forfirst-quarterobservations0otherwiseD2t={1forsecond-quarterobservations0otherwiseD3t={1forthird-quarterobservations0otherwise Forecast Savings-Marts sales of patio and lawn furniture for each quarter of 2010.arrow_forward
- The demand function for Newton’s Donuts has been estimated as follows:Qx = -14 – 54Px + 45Py + 0.62Ax where Qx represents thousands of donuts; Px is the price per donut; Py is the average price per donut of other brands of donuts; and Ax represents thousands of dollars spent on advertising Newton’s Donuts. The current values of the independent variables are Ax=120, Px=0.95, and Py=0.64.Show all of your calculations and processes. Describe your answer for each question in complete sentences, whenever it is necessary. Calculate the price elasticity of demand for Newton’s Donuts and describe what it means. Describe your answer and show your calculations. Derive an expression for the inverse demand curve for Newton’s Donuts. Describe your answer and show your calculations. If the cost of producing Newton’s Donuts is constant at $0.15 per donut, should they reduce the price and thereafter, sell more donuts (assuming profit maximization is the company’s goal)? Should Newton’s Donuts spend…arrow_forwardWharton Econometric Forecasting, LLC has been hired to analyze demand in 30 regional markets for Product Y, a major item. A statistical analysis of demand in these markets shows (standard errors in parentheses): QY = 26,950 − 450P + 220PX + 0.08A + 0.01I (11,000) (150) (180) (0.3) (0.05) R2 = 0.95 Standard Error of the Estimate = 10 Here, QY is market demand for Product Y, P is the price of Y in dollars, A is dollars of advertising expenditures, PX is the average price in dollars of another (unidentified) product, and I is dollars of household income. In a typical market, the price of Y is $100, PX is $70, advertising expenditures are $50,000, and the average family income is $60,000. 1. Which variables in this regression model are statistically significant at the 95 percent confidence level? Show your work.arrow_forwardWharton Econometric Forecasting, LLC has been hired to analyze demand in 30 regional markets for Product Y, a major item. A statistical analysis of demand in these markets shows (standard errors in parentheses): QY = 26,950 − 450P + 220PX + 0.08A + 0.01I (11,000) (150) (180) (0.3) (0.05) R2 = 0.95 Standard Error of the Estimate = 10 Here, QY is market demand for Product Y, P is the price of Y in dollars, A is dollars of advertising expenditures, PX is the average price in dollars of another (unidentified) product, and I is dollars of household income. In a typical market, the price of Y is $100, PX is $70, advertising expenditures are $50,000, and average family income is $60,000. Use the estimated demand function to calculate the expected value of QY in a typical market. Calculate the 95% confidence interval within which you would expect to find actual values of sales.…arrow_forward
- A large company in the communication and publishing industry has quantified the relationship between the price of one of its products and the demand for this product as Price = 150−0.01 × Demand for an annual printing of this particular product. The fixed costs per year (i.e., per printing) = $50,000 and the variable cost per unit=$40. What is the maximum profit that can be achieved if the maximum expected demand is 6,000 units per year? What is the unit price at this point of optimal demand?arrow_forwardThe demand function for a product is given by P = 4000/ln (x+10), where P is the price per unit in dollars when x units are demanded.i. Find the rate of change of price with respect to the number of units sold when 40 units are sold ii. Find the rate of change of price with respect to the number of units sold when 90 units are sold.iii. Find the second derivative to see whether the rate at which the price is changing at 40 units is increasing or decreasing.arrow_forwardThe market demand for a monopoly firm is estimated to be: Qd = 80,000 -400P + 3M + 2000PR where Q is output, P is price, M is income, and PR is the price of a related good. The manager has forecasted the values of M and PR will be $60,000 and $15, respectively, in 2018. For 2018, the forecasted demand function is…arrow_forward
- On September 2, 2021, the Malaysian government set a ceiling retail price of RM19.90 for COVID-19 Self-Test Kit, which would take effect on September 5, 2021. Discuss the advantages and disadvantages of the policy.arrow_forwardFormulate the demand equations and estimate Qd for P=33 by using the following data: Price level Quantity Demand 38 200 36 500 34 800 32 900 30 1000 28 1400arrow_forwardRex manufacturing purchases a printed circuit board for use in its automatic, computerized, robotbartender. The manufacturing facility has placed the following monthly demands on purchasedgoods inventory during the past year. Month 1 2 3 4 5 6 7 8 9 10 11 12 Demand 205 193 197 220 202 226 179 197 186 202 179 214 This demand schedule can be assumed to be random, to follow a normal distribution, and to berepresentative of what will occur in the future. Rex estimates that a fixed cost of $300 isincurred each time an order is placed for the boards, and that the inventory holding cost is about20% per year of the value of inventory. Each board has an estimated value of $192 at the pointof storage. The lead time on purchase orders is (1/5) month.Part A: What is the EOQ?Part B: What is the safety stock required to assure the management that the chance of a stock outin a cycle is no more than 1%?Part C: What is the reorder level?arrow_forward
 Managerial Economics: Applications, Strategies an...EconomicsISBN:9781305506381Author:James R. McGuigan, R. Charles Moyer, Frederick H.deB. HarrisPublisher:Cengage Learning