
MATLAB: An Introduction with Applications
6th Edition
ISBN: 9781119256830
Author: Amos Gilat
Publisher: John Wiley & Sons Inc
expand_more
expand_more
format_list_bulleted
Related questions
Question
Solve for subsections:
- a
- b
- c
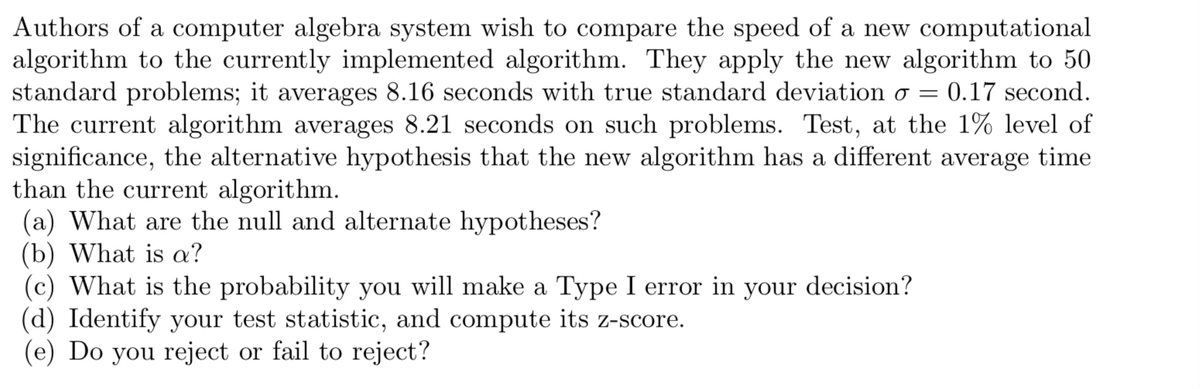

Transcribed Image Text:Authors of a computer algebra system wish to compare the speed of a new computational
algorithm to the currently implemented algorithm. They apply the new algorithm to 50
standard problems; it averages 8.16 seconds with true standard deviation o = = 0.17 second.
The current algorithm averages 8.21 seconds on such problems. Test, at the 1% level of
significance, the alternative hypothesis that the new algorithm has a different average time
than the current algorithm.
(a) What are the null and alternate hypotheses?
(b) What is a?
(c) What is the probability you will make a Type I error in your decision?
(d) Identify your test statistic, and compute its z-score.
(e) Do you reject or fail to reject?
Expert Solution
This question has been solved!
Explore an expertly crafted, step-by-step solution for a thorough understanding of key concepts.

Step by stepSolved in 2 steps

Knowledge Booster

Similar questions
- 3) Examine your t-test score in the paired samples t-test table. Is the p value significant? State in one to two sentences whether the test was significant and interpret this result.arrow_forwardCraig owns a ready mis concrete company. Craig receives an order for 1.5 cubic yards of concrete. This mixture of concrete contains sand, cement, gravel, and water; for each pound of water, there are 5lb of sand, 2lb of cement, and 7lb of gravel. Find the total weight of the order (in pounds), assuming a cubic yeard of concrete weighs 4000 lb, and how many pounds of each ingredient must be used. answer in the back of the book is: water: 400lb sand: 2000lb cement: 800lb gravel: 2800lb please help me set up the equations needed to solve the problem and get the answers given.arrow_forwardFor landscape maintenance Gretchen Green uses 4 pounds of fertilizer for every 200 square feet of lawn. At this rate, how many pounds of fertilizer did she use on a lawn that measures 8600 square feet? Round to the nearest whole number. arrow_forward
arrow_back_ios
arrow_forward_ios
Recommended textbooks for you
- MATLAB: An Introduction with ApplicationsStatisticsISBN:9781119256830Author:Amos GilatPublisher:John Wiley & Sons Inc
 Probability and Statistics for Engineering and th...StatisticsISBN:9781305251809Author:Jay L. DevorePublisher:Cengage Learning
 Statistics for The Behavioral Sciences (MindTap C...StatisticsISBN:9781305504912Author:Frederick J Gravetter, Larry B. WallnauPublisher:Cengage Learning
  Elementary Statistics: Picturing the World (7th E...StatisticsISBN:9780134683416Author:Ron Larson, Betsy FarberPublisher:PEARSON
 The Basic Practice of StatisticsStatisticsISBN:9781319042578Author:David S. Moore, William I. Notz, Michael A. FlignerPublisher:W. H. Freeman
 Introduction to the Practice of StatisticsStatisticsISBN:9781319013387Author:David S. Moore, George P. McCabe, Bruce A. CraigPublisher:W. H. Freeman
MATLAB: An Introduction with Applications
Statistics
ISBN:9781119256830
Author:Amos Gilat
Publisher:John Wiley & Sons Inc
Probability and Statistics for Engineering and th...
Statistics
ISBN:9781305251809
Author:Jay L. Devore
Publisher:Cengage Learning
Statistics for The Behavioral Sciences (MindTap C...
Statistics
ISBN:9781305504912
Author:Frederick J Gravetter, Larry B. Wallnau
Publisher:Cengage Learning
Elementary Statistics: Picturing the World (7th E...
Statistics
ISBN:9780134683416
Author:Ron Larson, Betsy Farber
Publisher:PEARSON
The Basic Practice of Statistics
Statistics
ISBN:9781319042578
Author:David S. Moore, William I. Notz, Michael A. Fligner
Publisher:W. H. Freeman
Introduction to the Practice of Statistics
Statistics
ISBN:9781319013387
Author:David S. Moore, George P. McCabe, Bruce A. Craig
Publisher:W. H. Freeman