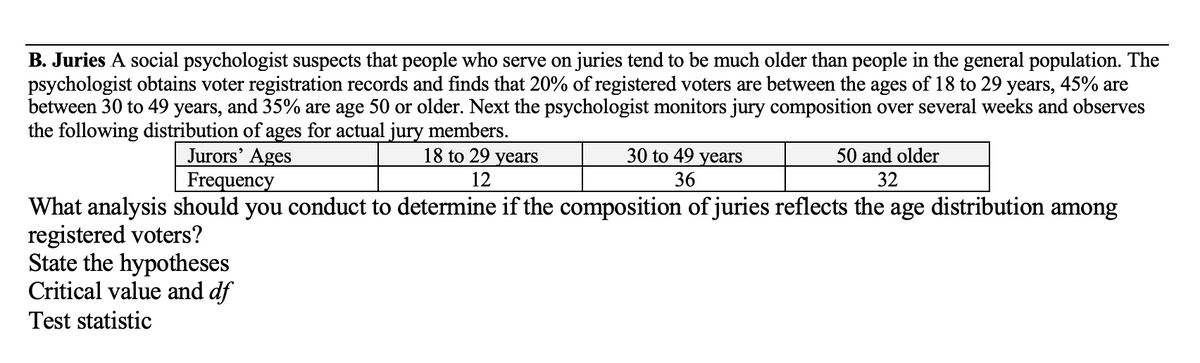
B. Juries A social psychologist suspects that people who serve on juries tend to be much older than people in the general population. The psychologist obtains voter registration records and finds that 20% of registered voters are between the ages of 18 to 29 years, 45% are between 30 to 49 years, and 35% are age 50 or older. Next the psychologist monitors jury composition over several weeks and observes the following distribution of ages for actual jury members. Jurors’ Ages Frequency 18 to 29 years 30 to 49 years 50 and older 12 36 32 What analysis should you conduct to determine if the composition of juries reflects the age distribution among registered voters? State the hypotheses Critical value and df Test statistic
B. Juries A social psychologist suspects that people who serve on juries tend to be much older than people in the general population. The psychologist obtains voter registration records and finds that 20% of registered voters are between the ages of 18 to 29 years, 45% are between 30 to 49 years, and 35% are age 50 or older. Next the psychologist monitors jury composition over several weeks and observes the following distribution of ages for actual jury members. Jurors’ Ages Frequency 18 to 29 years 30 to 49 years 50 and older 12 36 32 What analysis should you conduct to determine if the composition of juries reflects the age distribution among registered voters? State the hypotheses Critical value and df Test statistic

Glencoe Algebra 1, Student Edition, 9780079039897, 0079039898, 2018
18th Edition
ISBN:9780079039897
Author:Carter
Publisher:Carter
Chapter10: Statistics
Section10.6: Summarizing Categorical Data
Problem 10CYU

Related questions

Question
Transcribed Image Text:B. Juries A social psychologist suspects that people who serve on juries tend to be much older than people in the general population. The
psychologist obtains voter registration records and finds that 20% of registered voters are between the ages of 18 to 29 years, 45% are
between 30 to 49 years, and 35% are age 50 or older. Next the psychologist monitors jury composition over several weeks and observes
the following distribution of ages for actual jury members.
Jurors' Ages
Frequency
18 to 29 years
30 to 49 years
50 and older
12
36
32
What analysis should you conduct to determine if the composition of juries reflects the age distribution among
registered voters?
State the hypotheses
Critical value and df
Test statistic
Expert Solution
This question has been solved!
Explore an expertly crafted, step-by-step solution for a thorough understanding of key concepts.

This is a popular solution!

Trending now
This is a popular solution!

Step by step
Solved in 2 steps

Knowledge Booster


Learn more about
Need a deep-dive on the concept behind this application? Look no further. Learn more about this topic, statistics and related others by exploring similar questions and additional content below.Recommended textbooks for you
Glencoe Algebra 1, Student Edition, 9780079039897…
Algebra
ISBN:
9780079039897
Author:
Carter
Publisher:
McGraw Hill

Algebra & Trigonometry with Analytic Geometry
Algebra
ISBN:
9781133382119
Author:
Swokowski
Publisher:
Cengage
Glencoe Algebra 1, Student Edition, 9780079039897…
Algebra
ISBN:
9780079039897
Author:
Carter
Publisher:
McGraw Hill
Algebra & Trigonometry with Analytic Geometry
Algebra
ISBN:
9781133382119
Author:
Swokowski
Publisher:
Cengage