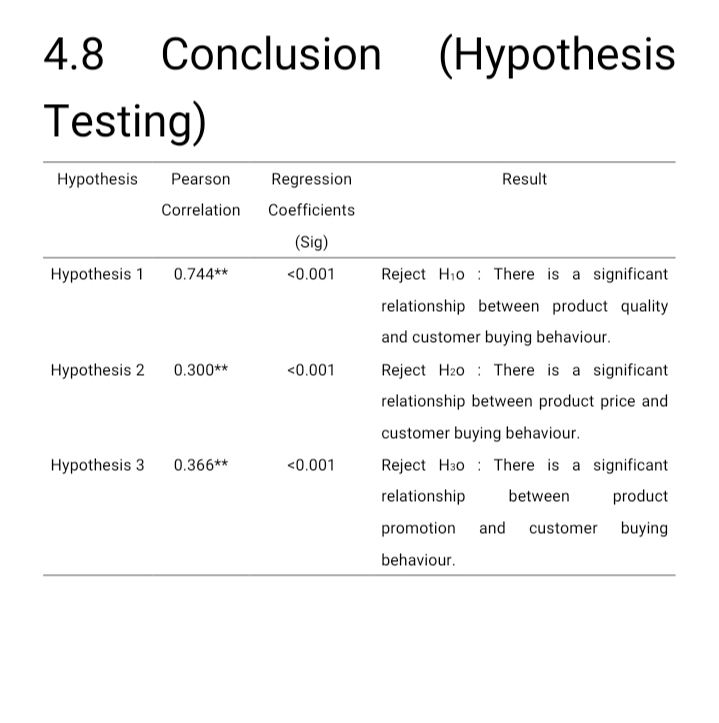
Based image, explain the table in one paragraph.


Q: Find the total of the areas under the standard normal curve to the left of z1=−2.33 and to the right…
A: We have given the z-scores for the standard normal distribution curve.Z1 = -2.33Z2 = 2.33We have to…
Q: Heights (cm) and weights (kg) are measured for 100 randomly selected adult males, and range from…
A: The regression equation is .
Q: As the supervisor in charge of shipping and receiving, you need to determine the average outgoing…
A: From the given information, the average defective rate (p) is 0.04.
Q: Let A and B be events with P (A)=0.8, P (B)=0.7, and P(A and B)=0.6. (a) Are A and B independent?…
A: A set of events that cannot occur simultaneously are termed 'mutually exclusive events'. If two…
Q: The variable df is defined to be the smaller of n₁ -1 and n₂-1. Find df if n₁ = 64 and n₂ = 60. df=…
A:
Q: Large samples of women and men are obtained, and the hemoglobin level is measured in each subject.…
A: The 95% confidence interval for the difference between the two population means is .
Q: 2. According to the Disney Times, 35% of all people in Never NeverLand are digitally illiterate.…
A:
Q: Fifteen students took a statistics pre-test and post-test. The results are below (a score of 28 is…
A: Hey there! Thank you for posting the question. Since your question has more than 3 parts, we are…
Q: What percent of the students who responded were Facebook users? What percent of the students in the…
A: The following two-way table displays data for the 219 students who responded to the AgeYounger…
Q: Researchers conducted a study to determine whether magnets are effective in treating back pain. The…
A: Data for treatment:Sample mean, Sample standard deviation, Sample size, Data for sham:Sample mean,…
Q: The bank manager wants to show that the new system reduces typical customer waiting times to less…
A: It is given that:Sample size: Sample mean: Population standard deviation:
Q: According to a survey, 58% of young Americans aged 18 to 29 say the primary way they watch…
A: p=0.58sample size(n)=300Mean()=p=0.58standard deviation()===0.0284956137
Q: Find the area under the standard normal curve to the right of z = 0.74. Round your answer to four…
A:
Q: Select the correct statement about the mean and median for the histogram below. 150 r 50 T 0 95 15…
A: The mean value and the median value gives an idea about the central value of the data.
Q: Use the probability distribution to complete parts (a) and (b) below. The number of defects per 1000…
A: Defects012345Probability0.2580.2890.2430.1520.0380.020
Q: SOLVE STEP BY STEP IN DIGITAL FORMAT 1.- The following data refer to the weight loss of certain…
A: Three different lubricants were used under controlled conditions: Lubric ALubric BLubric…
Q: Use a number between 0 and 1. Round using 2 decimal places) A box contains 2 red marbles and 8 blue…
A: To find the standard error (SE) for the percentage of red marbles drawn when the draws are made with…
Q: If event A is certain to occur, what is P(A)? 00 0 1 O 0.5 O 0.25 0.75 10000 RE DE BERE HOGE…
A: Event A is certain to occur. P(A) = ?
Q: Match each scatterplot shown below with one of the four specified correlations. O a. -0.89 b. -0.12…
A: The scatterplots and correlation coefficients are given.
Q: A graphing calculator is recommended. A researcher wants to know if the mean times (in minutes)…
A: The question is about ANOVAGiven :No. of news station ( k ) = 3No. of obs. in " C " ( n1 ) = 6No. of…
Q: Age limits 5.5-10.5 10.5-15.5 15.5-20.5 QUESTION ONE: The following data was obtained from a clinic…
A: The mean is calculated using all the observations. It explains the average of all the observations.…
Q: 54. Empirical Rule OK? The following histogram presents a data set with a mean of 62 and a standard…
A: A histogram presenting a data set with a mean of 62 and a standard deviation of 17.
Q: (S) test. The chance that a student is positive (P) is 10%. The information about the accuracy of…
A: a. To find the probability of a positive test result given that the student is actually positive, we…
Q: Which of the following statements are true? There may be more than one correct statement; check all…
A: There are two box plot given : Box -plot consist 5 number summary : { Minimum, Q1, Q2, Q3, Maximum }…
Q: Let JO, J1,..., J4 independent random variables according to the Ber (r₁) law, where i = 0, 1,...,…
A: In this problem, we are given five independent random variables, denoted as J0, J1, J2, J3, and J4.…
Q: A fish tank contains 17 goldfish, 3 angelfish, and 5 guppies. If a fish is selected at random from…
A:
Q: A market research survey is available for no cost. Using a decision tree analysis, it is found that…
A: Solution-:The expected value with the survey is $65000The expected value with no survey is $62000…
Q: 3. A manufacturing firm wants to determine if there is a difference in the prices charged by two…
A: T-testThe t-test is one of the hypothesis tests which is used when the population standard deviation…
Q: The accompanying table shows the numbers of male and female students in a particular country who…
A: The question is about conditional probabilityGiven :To find :a ) Prob. that a rand. selected student…
Q: One of New England Air's top competitive priorities is on-time arrivals. Quality VP Clair Bond…
A: Given the dataset as follows:To assess the quality of service, we will calculate the overall…
Q: If the probability that an event will happen is 0.27, what is the probability that the event won't…
A: Probability that event will happen = 0.27Probability that event will not happen = ?
Q: If investors want portfolios with small risk (variance), should they look for investments that have…
A:
Q: Testing: Ho: p=0.25 H₁: p > 0.25 Your sample consists of 149 subjects, with 33 successes. Calculate…
A:
Q: A boxplot for a set of data is given below. Find the five-number summary Find the minimum: Find Q₁:…
A: A boxplot for a data set is given.
Q: Why do you think it may be convenient in many situations to use a graph with only positive points?
A: Why do you think it may be convenient in many situations to use a graph with only positive points?
Q: Data on the weights (lb) of the contents of cans of diet soda versus the contents of cans of the…
A: DietRegularn39390.782820.81588s0.004310.00757
Q: Annual high temperatures in a certain location have been tracked for several years. Let X represent…
A: Solution-:Let, X=be the year and Y= High temperatureWe have following data:…
Q: In a large clinical trial, 399,884 children were randomly assigned to two groups. The treatment…
A: The significance level, The number of children in the treatment group, The number of children who…
Q: Body frame size is determined by a person's wrist circumference in relation to height. A researcher…
A: Since you have posted a question with multiple sub-parts, we will solve first three sub-parts for…
Q: -17 Let X₁, X2, and X3 be mutually independent random variables with the following probability…
A: We are given three independent random variables, X1, X2, and X3, with probability density functions…
Q: Researchers wondered whether the size of a person's brain was related to the individual's mental…
A: The provided paired observations of MRI and IQ for females and males…
Q: Listed are 29 ages for Academy Award winning best actors in order from smallest to largest. 18; 21;…
A: Solution-:Given…
Q: b) What is the significance of the above statistics? (
A: The statistics calculated in the previous question areThe mean age at which patients suffered from…
Q: Please answer parts a thru d quickly and correctly On a rainy day, 30% of people carry an umbrella,…
A: Let's denote the event of carrying an umbrella as and the event of wearing a raincoat as . We are…
Q: For a two-factor ANOVA, if SSwithin treatments = 86, SSbetween treatments = 80, SSbetween subjects =…
A: From the given information, SSwithin treatments = 86, SSbetween treatments = 80, SSbetween subjects…
Q: The data shown below are monthly rental costs of 15 randomly selected two-bedroom apartments in a…
A: Mean:It is an average. It is calculated using all the observationsIt is a measure of central…
Q: Suppose our target population is very large. To each observational unit we have a two-level factor…
A:
Q: number from 1 to 6) to choose the next quiz question. You suspect that the die is not fair, and one…
A: Given that: n= 90 Sample sizek= 6 Categories
Q: Sketch a bell curve for the SAT critical reading data with markings on the horizontal axis for +1…
A:
Q: Consider the following transition matrix. 0.3 0 0.7] 0.2 0.8 0 [0.4 0.2 0.4 a) Which states are…
A: Given the transition matrix of a Markov chain as
1. Based image, explain the table in one paragraph.

Step by step
Solved in 3 steps

- Olympic Pole Vault The graph in Figure 7 indicates that in recent years the winning Olympic men’s pole vault height has fallen below the value predicted by the regression line in Example 2. This might have occurred because when the pole vault was a new event there was much room for improvement in vaulters’ performances, whereas now even the best training can produce only incremental advances. Let’s see whether concentrating on more recent results gives a better predictor of future records. (a) Use the data in Table 2 (page 176) to complete the table of winning pole vault heights shown in the margin. (Note that we are using x=0 to correspond to the year 1972, where this restricted data set begins.) (b) Find the regression line for the data in part ‚(a). (c) Plot the data and the regression line on the same axes. Does the regression line seem to provide a good model for the data? (d) What does the regression line predict as the winning pole vault height for the 2012 Olympics? Compare this predicted value to the actual 2012 winning height of 5.97 m, as described on page 177. Has this new regression line provided a better prediction than the line in Example 2?Which of the following is/are true if the coefficient of determination between the response and the predictor variables is 81 percent based on a random sample of size n i. the pearson's sample correlation coefficient is +0.9 ii. this means that 19 percent of the total variation in the response variable remains unexplained by tge simple linear regression model that uses the given predictor variable iii both i and ii iv neither i and iia. Compute the correlation between price and mileage. (Round answers to 4 decimal points) Correlation: b. Which of the following is NOT an assumption made on the standard regression assumptions? Which of the following is true about the regression line multiple choice 2 The regression line minimizes the MSE of forecast errors. The regression line is the line with the largest prediction accuracy. The regression line minimizes the sum of the squares of the residuals. Regression may only be performed if the standard regression assumptions hold. All of the above. multiple choice 1 They all follow a binomial distribution They are all independent of each other They all have the same standard deviation They all have mean (expected value) 0
- (A) What do you understand by the term ‘autocorrelation’?(e) An econometrician suspects that the residuals of her model might be autocorrelated. Explain the steps involved in testing this theory using the Durbin–Watson (DW) test.Consider the regression model Y = B0 + B1 X1 + B2 X2 + u. Suppose you want to test the null hypothesis H0: B1 + B2 = 0, versus the alternative hypothesis H1: B1+ B2 != 0 (!= means "not equal to"). The data set consists of 100 observations. (a) Suppose we use an F-statistic to conduct the test. What are the degrees of freedom associated with this test statistic? (b) Let G(.) be the CDF of the F-distribution for the F-statistic in part (b). Denote the actual F-statistic by F_act. Suppose someone says that you should reject the null at the 5% significance level if G(F_act)<0.05. Explain whether you agree with this approach. (c) Suppose you find that the F-test in part (b)-(c) and the test in part (a) yield very different p-values. Do you think this result is correct? Briefly explain your reasoning.9) The following results are from a regression where the dependent variable is GRADUATION RATE and the independent variables are % OF CLASSES UNDER 20, % OF CLASSES OF 50 OR MORE, STUDENT/FACULTY RATIO, ACCEPTANCE RATE, 1ST YEAR STUDENTS IN TOP 10% OF HS CLASS. The data were split into 2 samples and the following regression results were obtained from the split data. a) What is heteroscedasticity? (b) Why is heteroscedasticity a problem? c) Based on a comparison of the two sets of output, does it appear that there is heteroscedasticity in the data set? Explain. Be sure to write down your null and alternative hypothesis, calculate the test statistic, and find your critical value (test at the 5% level of significance).
- Which of the following statements is/are correct about logistic regression? Logistic regression can be used for modeling the continuous response variable with dichotomous explanatory variable. Logistic regression can be used for modeling the dichotomous response variable with dichotomous explanatory variable. Logistic regression can be used for modeling the continuous response variable with dichotomous or other type of categorical explanatory variables. Logistic regression can be used for modeling the dichotomous response variable with dichotomous and not for continuous explanatory variables. Logistic regression can be used for modeling the dichotomous response variable with categorical explanatory variables and/or continuous explanatory variables.Which of the following statements about a least-squares regression analysis is true?I. A point with a large residual is an outlier.II. A point with high leverage has a -value that is not consistent with the other -values in the set.III. The removal of an influential point from a data set could change the value of the correlation coefficient.15.3 #6 The authors of the article "Age, Spacing and Growth Rate of Tamarix as an Indication of Lake Boundary Fluctuations at Sebkhet Kelbia, Tunisia"† used a simple linear regression model to describe the relationship between y = vigor (average width in centimeters of the last two annual rings) and x = stem density (stems/m2). The estimated model was based on the following data. Also given are the standardized residuals. x 4 5 6 9 14 15 15 19 21 22 y 0.75 1.20 0.55 0.60 0.65 0.55 0.00 0.35 0.45 0.40 Std resid −0.28 1.92 −0.90 −0.28 0.54 0.24 −2.05 −0.12 0.60 0.52 Are there any points with unusually large residuals? (Select all that apply.) A) (x, y) = (4, 0.75) B) (x, y) = (15, 0.00) C) (x, y) = (14, 0.65) D) (x, y) = (5, 1.20) E) (x, y) = (15, 0.55) F) (x, y) = (9, 0.60) G) (x, y) = (6, 0.55) H) none of the above
- 15.3 #6 The authors of the article "Age, Spacing and Growth Rate of Tamarix as an Indication of Lake Boundary Fluctuations at Sebkhet Kelbia, Tunisia"† used a simple linear regression model to describe the relationship between y = vigor (average width in centimeters of the last two annual rings) and x = stem density (stems/m2). The estimated model was based on the following data. Also given are the standardized residuals. x 4 5 6 9 14 15 15 19 21 22 y 0.75 1.20 0.55 0.60 0.65 0.55 0.00 0.35 0.45 0.40 Std resid −0.28 1.92 −0.90 −0.28 0.54 0.24 −2.05 −0.12 0.60 0.52 (a) What assumptions are required for the simple linear regression model to be appropriate? (Select all that apply.) A) The random errors associated with different observations are dependent on one another. B) The distribution of e at any given x is not normal. C) The distribution of e at any given x is normal. D) The distribution of e at any particular x value has mean value 0. E) The random…Answer true or false to the following statements and explain your answers. a. In multiple linear regression, we can determine whether we are extrapolating in predicting the value of the response variable for a given set of predictor variable values by determining whether each predictor variable value falls in the range of observed values of that predictor. b. Irregularly shaped regions of the values of predictor variables are easy to detect with two-dimensional scatterplots of pairs of predictor variables, and thus it is easy to determine whether we are extrapolating when predicting the response variable.

