c. Find the sum of squares of the regression and error and their corresponding mean squares. d. Test the usefulness of the regression model and the slope of the line of means. e. Find the coefficient of correlation and coefficient of determination of the regression model and interpret your results.
Q: Q3. The number of calories and number of milligrams of cholesterol for a random sample of fast- food…
A:
Q: The output of a different regression analysis on the effect of radio advertising spending on sales…
A: Here, there is only one predictor variable (radio advertising spending). Therefore, dfreg=p…
Q: The President of the Farmers Association wants to know how the amount of fertilizer and the amount…
A: i. In this case, the dependent variable is Growth and the independent variables are Water and…
Q: A marketing consultant created a linear regression model to predict the number of units sold by a…
A: Introduction: Suppose y is the response variable of interest, and there is a belief that y can…
Q: An accounting firm, in an effort to explain variation in client profitability, collected the data…
A: Solution: Based on the given data, we are asked to regress the dependent variable - Profitability on…
Q: According to the nutrition research, recommendation on the consumption of fiber for children and…
A:
Q: Using the data given in the question about Correlation between monthly advertising budget and the…
A: Let the regression line is given by y = a + bx, Where a is y-intercept, and b is slope of the…
Q: explain why the following statement is false A residual plot should show a pattern if the…
A: Residual Plot: It is the graphical representation of the residuals of a regression model. It is…
Q: (b) Interpret the regression coefficient for the fitted model.
A: Given, n=30, Sxx=759.8148 s=4.69245
Q: Briefly discuss the effect on a regression analysis of dependencies among the observations of the…
A: Dependencies among the values of the response variable:Presence of dependencies or correlations…
Q: Suppose that R2= 1 for a data set. What can you say abota. SSE? b. SSR? c. the utility of the sample…
A: a)Coefficient of multiple determination:
Q: a. The regression line has a positive slope. b. The correlation coefficient would be close to zero.…
A:
Q: Which of the following best describes the difference between the interpretation of the correlation…
A: Identify the correct option that interprets the difference between the interpretation of the…
Q: 1. What is the correlation of the correlation coefficient for the bivariate data? [Select] 2. Is…
A: The provided information is x y xy x2 y2 1.2 6.7 8.04 1.44 44.89 1.5 7.8 11.7 2.25 60.84…
Q: Suppose you are investigating a dataset and creating a sample linear regression model that yields a…
A: Researchers conduct t-test to test the usefulness of the slope coefficient.
Q: Which of the following is not an assumption for simple linear regression? Select one: a. Normally…
A: In simple linear regression y = a + bx, y is response variable ane only one explanatory variable x.
Q: The owner of Showtime Movie Theaters, Inc., used multiple regression analysis to predict gross…
A: a. R2=SSRSST =32.734.9 =0.937 Adj R2=1-1-R2N-1N-p-1, N=sample size and p=number of variables…
Q: Accountants at the Tucson firm, Larry Youdelman CPAs believed that several traveling executives were…
A: The multiple regression equation is ŷ = 95 + 50.5x1 + 0.40x2. here the independent variables x1 and…
Q: Which of these situations could be analyzed with regression analysis? A. relationship between gender…
A: In multiple linear regression, there will be more than one independent variable. In simple linear…
Q: In the correlation coefficient r = 0.78, what percentage of variation in y is explained by the…
A:
Q: 13. What proportion of the variance in Course % is attributable to the regression model? A- .568…
A: 13) The proportion of variance in course is attributable to the regression model is R-square.
Q: find the (a) explained variation, (b) unexplained variation, and (c) indicated prediction interval.…
A: The data shows the amounts of court income (thousands of dollars) and salaries (thousands of…
Q: In a linear regression, ɛ, read as epsilon, is Multiple Choice O a dummy variable. the unrounded…
A: The linear regression equation is written as y=α+β1x1+ε where y: Dependent variable α: Intercept x:…
Q: Using your favorite statistics software package, you generate a scatter plot with a regression…
A: Given data, y=59.31x+26.22 r=0.161 proportion of the variation in y=?
Q: Suppose that R2 = 1 for a data set. What can you say abouta. SSE?b. SSR?c. the utility of the sample…
A: According to the provided data, the value of R2 for a data set is 1.a. The value of SSE is,
Q: D. What would be the slope and y-intercept for a regression line based on these data? E. What wouıld…
A: D. Regression: The regression analysis is conducted here by using EXCEL. The software procedure is…
Q: A researcher wants to predict the effect of the number of times a person eats every day and the…
A: Inferential Statistics: A statistical domain described as inferential analysis entails a method that…
Q: Which of the following situations would have data sets or plots that could have a regression line…
A: From the given statements, The cumulative number of ships launched by ship builders as a function of…
Q: WHICH IS THE EXPLANATORY VARIABLE, AND WHICH IS THE RESPONSE VARIABLE IN THIS REGRESSION LINE ?…
A: Given that Regression equation WINS=5.3+0.3(PRE*SEASON) AT PRE*SEASON=4 Regression equation…
Q: a) Give a practical interpretation of the y-intercept of the regression line. b) What is the…
A: a) In this case years of schooling (x) is the independent variables and median hourly wage gain (y)…
Q: Discuss the relationship of the negative sign or positive sign in the value of correlation…
A:
Q: How much of the variation in mean cost of hospital stay is explained by the least-squares regression…
A: Given: Cost, y Number x 10.3 34.1 10.3 34.2 11.3 34.7 11.8 34.9 12.5 35.5 13.7 36.4…
Q: According to the nutrition research, recommendation on the consumption of fiber for children and…
A: (b) EXCEL procedure: Go to EXCEL Go to Data>Data Analysis. Choose Regression. Input Y range…
Q: The following regression model was estimated. Q is the number of meals served, P is the average…
A: Hello! As you have posted more than 3 sub parts, we are answering the first 3 sub-parts. In case…
Q: At 5% significance level, is there evidence of a linear relationship between shelf space and sales?…
A: Here use formula of correlation coefficient and regression line to answer the part c and d
Q: 6. Interpret the slope of the regression line in context .
A: Given data in question table Coefficient of Slope line =0.2838
Q: d. Using the regression results reported above, please calculate and interpret the separate effects…
A: From the given tables, Variables Coef. p-value Constant 0.5311 0.000 Sat…
Q: What is the null hypothesis to test the significance of the slope in a regression equation? Multiple…
A:
Q: Complete the statement. When all points fall on the regression line, the value of the correlation…
A: # When all points fall on the regression line, the value of the correlation coefficient is...??
Q: For a two-variable linear regression, if the sample correlation between the depen- dent and…
A: Given Information: The sample correlation coefficient between two variables is r=-0.7. The…
Q: The following regression model was estimated. Q is the number of meals served, P is the average…
A: Hello. Since your question has multiple sub-parts, we will solve first three sub-parts for you. If…
Q: I’m interested in seeing whether or not there is a relationship between the number of hours someone…
A: As per our guidelines we can solve first three sub part of question and rest can be reposted.…
Q: In order to determine whether to use linear regression or non-linear regression, what is the first…
A: As per our guidelines, we are allowed to answer first question only. Please re-post next question.…
Q: Suppose that you are interested in the relationship between Reading and Writing scores. (c) Compute…
A: Solution we will solve it by using excel and the steps are Enter the Data into excel Click on Data…
Q: A. Do these data provide sufficient evidence that there is a positive linear relationship between…
A: The regression concept was introduced by Sir Francis Galton and correlation is introduced by Karl…
Q: a. Use the data to find the regression equation for predicting memory scores from the percentage of…
A: Given data: Country % Retired (X) Memory Score (Y) Sweden 39 9.3 U.S.A 48 10.9 England 59…
Q: A study was made by a retail merchant to determine the relation between weekly advertising…
A: Use EXCEL to determine the regression equation. EXCEL procedure: Go to EXCEL Go to Data>Data…
Q: The data in the table represent the number of licensed drivers in various age groups and the number…
A: “Since you have posted a question with multiple sub-parts, we will solve first three subparts for…
Q: (a) What is the dependent variable in this regression? (b) What are the independent variable(s) in…
A: Since you have posted a question with multiple sub-parts, we will solve first three subparts for…
Could you please solve the subparts d and e?
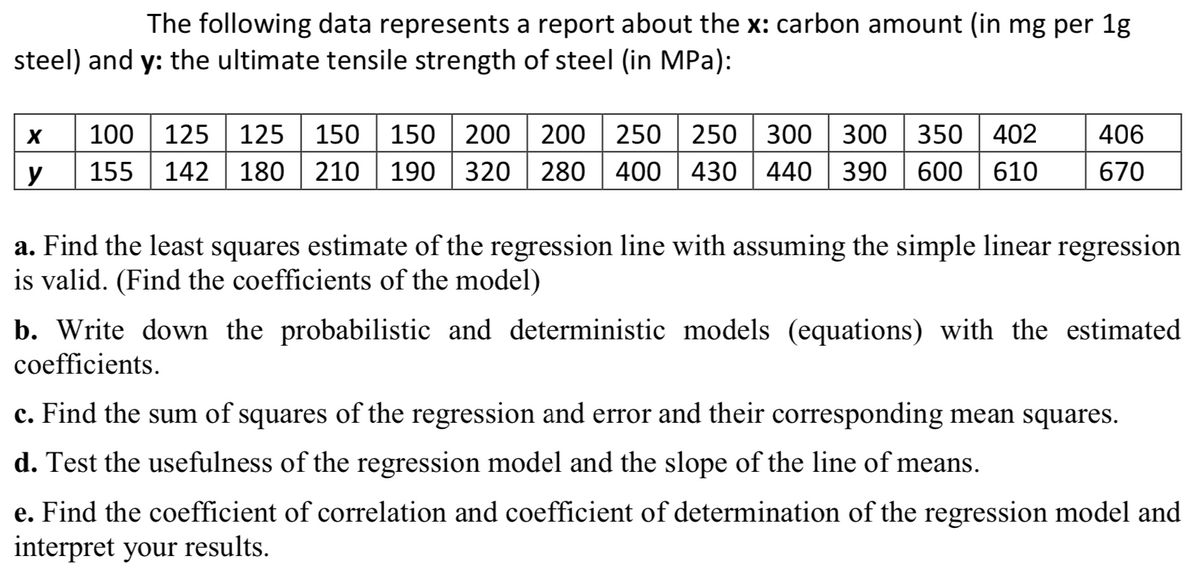
Step by step
Solved in 3 steps
- The following fictitious table shows kryptonite price, in dollar per gram, t years after 2006. t= Years since 2006 0 1 2 3 4 5 6 7 8 9 10 K= Price 56 51 50 55 58 52 45 43 44 48 51 Make a quartic model of these data. Round the regression parameters to two decimal places.Find the equation of the regression line for the following data set. x 1 2 3 y 0 3 4The following data is representative of that reported in an article on nitrogen emissions, with x = burner area liberation rate (MBtu/hr-ft2) and y = NOx emission rate (ppm): x 100 125 125 150 150 200 200 250 250 300 300 350 400 400 y 140 150 180 210 190 310 270 410 440 450 380 600 600 670 (a) Assuming that the simple linear regression model is valid, obtain the least squares estimate of the true regression line. (Round all numerical values to four decimal places.)y = (b) What is the estimate of expected NOx emission rate when burner area liberation rate equals 200? (Round your answer to two decimal places.) ppm(c) Estimate the amount by which you expect NOx emission rate to change when burner area liberation rate is decreased by 60. (Round your answer to two decimal places.) ppm(d) Would you use the estimated regression line to predict emission rate for a liberation rate of 500? Why or why not? Yes, the data is perfectly linear, thus lending to accurate…
- The following data is representative of that reported in an article on nitrogen emissions, with x = burner area liberation rate (MBtu/hr-ft2) and y = NOx emission rate (ppm): x 100 125 125 150 150 200 200 250 250 300 300 350 400 400 y 160 140 190 210 200 320 280 400 440 430 400 600 600 660 (a) Assuming that the simple linear regression model is valid, obtain the least squares estimate of the true regression line. (Round all numerical values to four decimal places.)y = (b) What is the estimate of expected NOx emission rate when burner area liberation rate equals 240? (Round your answer to two decimal places.)ppm(c) Estimate the amount by which you expect NOx emission rate to change when burner area liberation rate is decreased by 60. (Round your answer to two decimal places.)ppm(d) Would you use the estimated regression line to predict emission rate for a liberation rate of 500? Why or why not? Yes, the data is perfectly linear, thus lending to accurate predictions.…For the past decade, rubber powder has been used in asphalt cement to improve performance. An article includes a regression of y = axial strength (MPa) on x = cube strength (MPa) based on the following sample data: x 112.3 97.0 92.7 86.0 102.0 99.2 95.8 103.5 89.0 86.7 y 75.4 71.3 58.1 48.5 74.1 73.7 67.7 59.5 58.0 48.6 (a) Obtain the equation of the least squares line. (Round all numerical values to four decimal places.)y = Interpret the slope. A one MPa increase in axial strength is associated with an increase in the predicted cube strength equal to the slope.A one MPa decrease in cube strength is associated with an increase in the predicted axial strength equal to the slope. A one MPa increase in cube strength is associated with an increase in the predicted axial strength equal to the slope.A one MPa decrease in axial strength is associated with an increase in the predicted cube strength equal to the slope. (b) Calculate the coefficient of determination.…For the past decade, rubber powder has been used in asphalt cement to improve performance. An article includes a regression of y = axial strength (MPa) on x = cube strength (MPa) based on the following sample data: x 112.3 97.0 92.7 86.0 102.0 99.2 95.8 103.5 89.0 86.7 y 74.6 71.1 57.5 48.4 74.0 72.9 68.3 59.8 57.6 48.0 (a) Obtain the equation of the least squares line. (Round all numerical values to four decimal places.)y = −32.6485+0.9943x Interpret the slope. A one MPa increase in axial strength is associated with an increase in the predicted cube strength equal to the slope.A one MPa decrease in cube strength is associated with an increase in the predicted axial strength equal to the slope. A one MPa decrease in axial strength is associated with an increase in the predicted cube strength equal to the slope.A one MPa increase in cube strength is associated with an increase in the predicted axial strength equal to the slope. (b) Calculate the coefficient of…
- The following data show the number of class sessions missed during a semester of SOC221 and the final grade for a sample of 8 students selected at random. Number of Sessions Missed Final Grade (x) (y) 0 96 2 88 12 68 6 91 8…The table contains data on vehicle speed (h) and fuel consumption (lt / 100km) of 5 randomly selected vehicles. Estimate the average fuel consumption of a vehicle traveling at 45 km / h using the simple linear regression equation between vehicle speed and fuel consumption. Speed 55 60 65 70 75 Consumption 13 12 11 10 9 a. 15 b. 8 c. 7 d. 20The following table lists the birth weights (in pounds), x, and the lengths (in inches), y, for a set of newborn babies at a local hospital. Birth Weights and Lengths Birth Weight (in Pounds), x 1212 1010 88 1111 1111 33 55 44 77 66 Length (in Inches), y 2121 2020 1717 2222 2222 1616 1717 1616 1919 1919 Copy Data Step 1 of 2 : Find an equation of the least-squares regression line. Round your answer to three decimal places, if necessary.
- The table below shows (lifetime) peptic ulcer rates (per 100 population), UU, for various family incomes, xx, as reported by the 1989 National Health Interview Survey. Income 4000 6000 8000 12000 16000 20000 30000 45000 60000 Ulcer rate 14.1 13.1 13.8 12.6 11.8 11.7 11.5 9.3 7.6 (a) Find the equation of the regression line. Ulcer rate, U(x)= . (b) Estimate the peptic ulcer rate for an income level of x0= 25000 according to the linear model in part (a). Ulcer rate, U(x0)= .A U.S. state's Bureau of Economic Geology published a study on the economic impact of using carbon dioxide enhanced oil recovery (EOR) technology to extract additional oil from fields that have reached the end of their conventional economic life. The following table gives the approximate number of jobs for the citizens that would be created at various levels of recovery. Percent Recovery (%) 20 40 80 100 Jobs Created (Millions) 6 9 12 18 Find the regression line. j(r) = Use the regression line to estimate the number of jobs that would be created at a recovery level of 60%. _____ million jobsTo study the tensile strength of a certain type of wire, the following pairs of observations were recorded, wherex is the diameter in cm and y is the mass supported in kg/cm.x: 0.6 0.8 1.0 1.2 1.4 1.6 1.8 2.0 2.2 2.4y: 14 26 50 56 42 98 82 88 134 124 Calculate the least-squares regression line and extrapolate the regression line to a diameter of 0.2 cm. Alsoexplain your result.