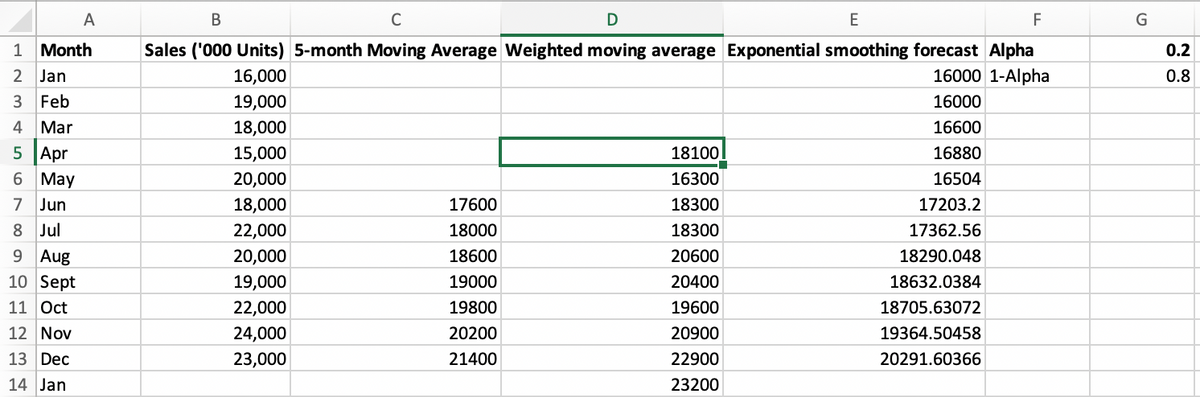
Calculate the MAPE for each of the 3 forecast models used in the table. Which should be used for forecasting efforts, and why?


Q: It has been said the vitamin C has the ability to cure or prevent the common cold. Residents at a…
A: For the given data (a) Describe how you would conduct a hypothesis test for this case.…
Q: mployees must complete new machine set ups within 30 New machine set-up times can be described by a…
A: Given: Population mean μ=22 Population standard deviation σ=4 Let X ~ N(22, 42)
Q: a gasoline processor is developing a reasonably priced gasoline that will deliver improved gasoline…
A: Given data: A 3 2 5 6 3 1 B 5 8 9 6 2 5 C 1 3 4 2 7 3
Q: The data represents the heights of eruptions by a geyser. Use the heights to construct a stemplot.…
A:
Q: Here is a bivariate data set. X 51.3 11.7 43.8 -2.9 173.8 27.7 109.3 50.9 40.6 y 19.3 115.1 41.8…
A: The bivariate data set contains x and y variables with 13 observations.
Q: dents handed out 40 survey questionaires for 75.3% of the population. Determine the margin of error…
A: Given data,n=40p=75.3% =0.753Determine the margin of error of their conducted survey?
Q: 1. It has been reported that the length of human pregnancies from conception to birth approximately…
A: Since you have asked multiple questions, we will solve the first question for you. If you want any…
Q: The following are the GPAs of 18 r/s SCC students: 1.3, 1.5, 1.7, 2.2, 2.5, 2.6, 2.6, 2.6, 2.6, 2.8,…
A: Since you have posted a question with multiple sub-parts, we will solve first 3 sub-parts for you.…
Q: (a) Enter the expected frequencies below: X Y A B (b) What is the chi-square test-statistic for this…
A: Given that X Y Z A 42 22 5 B 41 31 15 Note: According to bartleby experts question…
Q: You wish to test the following claim (Hå) at a significance level of a = 0.05. Ho: P₁ = P2 Ha: P₁ P2…
A:
Q: How do you find sample variance and population variance?
A: Sample Variance: The variance is calculated using the sample data as given the sample variance.…
Q: e z scores to compare the given values. used on sample data, newborn males have weights with a mean…
A: given data,based on the sample data,new boen male :- μ = 3282.9 x = 1700new born female :-μ =…
Q: nite. 83 Jaguar. 129 Jeep. 128 Kia. 135 Land Rover 175 Lexus. 107 Lincoln. 93 Mazda. 114…
A: Hint: A Stem and leaf plot displays numerical data by splitting each data point into a "leaf "…
Q: QUESTION 42 "An independent samples study exhibted the following sample characteristics: Sample 1, n…
A: We have given that, For sample 1, n1 = 52, SS1 = 296.3 And n2 = 55, SS2 =256.4 Then, We will find…
Q: 16; 17; 17; 20; 20; 21; 23; 24; 25; 25; 25; 26; 26; 26; 27; 27, 28, 29, 30, 32, 33, 33, 34, 35, 37,…
A:
Q: 5. The following data are direct solar (watts/m2) at intensity measurements a location in southern…
A: The question is about grouped frequency distribution Given : Starting first class interval = 450 -…
Q: O % Increase % Increase 4221 SL86 40-49.9 50-59.9 60-69.9 70-79.9 80-89.9 90-99.9 100-109.9…
A: The given data for the percentage increase is: For obtaining the appropriate frequency histogram,…
Q: All of these answers have been marked incorrect in my school's grading system.
A: As per our guidelines we can solve first three sub part of question and rest can be reposted.…
Q: Test the claim that the mean GPA of Orange Coast students is larger than the mean GPA of Coastline…
A: Given, we assume O for orange coast students; nO = 25 xO = 3.29 sO = 0.03 we assume C for coastline…
Q: b) Find the area under the standard normal curve to the right of 21.06 OC
A:
Q: Calculate the sum of squared deviations (SS) for the set of scores presented below: X 4 70 71 1 74…
A:
Q: he doctor has finally figured out what is wrong with you and prescribes a medicine that will help…
A: here the bottle has 100 mg per 15 ml
Q: the correct answer below. The term linear refers to the straight line that passes through the…
A:
Q: Use the Pareto chart to tell the percentage of students that enrolled at a private 4-year college.…
A: Pareto Chart: A bar graph or a chart including both bars and lines is a Pareto chart. This graph is…
Q: Let X = {x, y, z} and B={{x,y}, {x, y, z}} and C({x,y})= {x}. Which of the following are consistent…
A: Let X = {x, y, z) and B={{x, y}, {x, y, z}} and C({x, y})= {x}. Which of the following are…
Q: Example 14.3 The following table shows the tons of steel produced versus the number of workers in a…
A:
Q: A sample of midterm grades for five students showed the following results: 69, 62, 79, 87, 73. Which…
A: Given: Midterm grades for five students are: 69, 62, 79, 87, 73. The objective is to identify the…
Q: Three students were applying to the same graduate school. They came from schools with different…
A: From the provided information, Student GPA (x) Scholl Average GPA (µ) School standard…
Q: QUESTION 52 "A significant ANOVA determined there was a difference in GPA based on birth oder. Using…
A: Anova is the measure of parametric test. It compare the mean significance between the groups. If…
Q: If ß represents the number of units of change in y for every one- unit change in x (i.e. the slope)…
A: Given that,
Q: Let a population consist of the values 10 cigarettes, 11 cigarettes, and 20 cigarettes smoked in a…
A: Given Information: The population consists of values: 10, 11, 20 All possible samples of size 2 with…
Q: What is the value of the test statistic, F?
A:
Q: The capacities at which U.S. nuclear power plants are working are shown in table for various years.…
A: Given that: The model is given as, ft=0.027t2+0.216t+53.296 Here, f(t) is the capacity t which US…
Q: Our environment is very sensitive to the amount of ozone in the upper atmosphere. The level of ozone…
A: Given Population mean μ=4.1, n=sample size=66, sample mean x̄=4.3, sample variance=s2=1, level of…
Q: describe the graphs the data and trends
A: Given information: Bar graph for the Male and female for the head, elbow, shoulder and wrist.…
Q: A random sample of n = 11 observations from a normal population produced x = 47.7 and s² = 4.4. Test…
A: given data n = 11 Ho: μ=48Ha: μ≠48α=0.05x¯ = 47.7s2 = 4.4
Q: As the years (t) go by revenue (r) at a small business increases continuously $1000's Revenue(r)…
A: Given data: Year(t) $1000's Revenue(r) 4.0 169.00 5.0 214.00 6.0 243.00 7.0 301.00 8.0…
Q: lower bound: upper bound: mpg (please round to two decimal places) mpg (please round to two decimal…
A: Given: Hwy MPG, Automatic Hwy MPG, Manual Mean 22.92 27.88 SD 5.29 5.01 n 26 26
Q: The strength of steel wire made by an existing process is normally distributed with a mean of 1250.…
A:
Q: You wish to test the following claim (Ha) at a significance level of a = 0.001. Ho: P₁ = P2 Ha: P₁…
A: From the provided information, Level of significance (α) = 0.001
Q: Blood serum cholesterol level of 10 persons are as under: 240,260,290,245,255,288,272,263,277,257.…
A:
Q: Refer to the sample data for pre-employment drug screening shown below. If one of the subjects is…
A: False positive : The situation of false positive result occurs when the test gives positive result…
Q: How many different outcomes are possible for 13 tosses of a coin?
A: Given that How many different outcomes are possible for 13 tosses of a coin
Q: Consider the following data find the expected value E(X).Round your answer to one decimal place.
A: Given that x -5 -4 -3 -2 -1 P(X = x ) 0.2 0.3 0.2 0.1 0.2
Q: QUESTION 33 "A clinican has found a significant effect of a new drug and wants to know the effect…
A: Given that Population mean = μ = 40 Population standard deviations= σ = 2.5 Sample mean = x̄ = 36…
Q: A particular fruit's weights are normally distributed, with a mean of 217 grams and a standard…
A:
Q: The histogram shows the number of miles driven by a sample of automobiles in New York City. What is…
A: From the given histogram we only have two labelled class mid points 10000 and 40000. From this class…
Q: Which would be the most appropriate measure of central tendency to use for each of the following…
A: the most appropriate measure of central tendency to use for each of the following variables
Q: Least squares practice find the best-fit line for the following data sets. Plot the points and the…
A: Given: Sample size(n)=3 x y xy x^2 y^2 -1 0 0 1 0 0 6 0 0 36 3 8 24 9 64…
Q: in a frequency distribution the coefficient of skewed ness based on quartiles is 0.6. it the sum of…
A:
Calculate the MAPE for each of the 3 forecast models used in the table.
Which should be used for forecasting efforts, and why?

Step by step
Solved in 2 steps

- What does the y -intercept on the graph of a logistic equation correspond to for a population modeled by that equation?Distinguish between: a univariance function and multivariate function An exponential growth process and exponential decay processStrands of human hair absorb elements from the bloodstream and provide a historical record of both health and the use or nonuse of chemical substances. Hair grows at the rate of about one – half inch per month, and a person with long hair might be accused or absolved on the basis of a segment of hair that sprouted many months or years ago. By separately analyzing sections of the hair strand, scientists can even approximate the periods of time during which drug use was heavy, moderate, light or altogether absent. If a transit employee provides a strand of hair for drug testing, state the null and alternative hypothesis in verbal terms, then identify what would constitute a Type I error and Type II error in this situation.
- DiabetesA group of 10-year-old boys were first ascertained in acamp for diabetic boys. They had their weight measuredat baseline and again when they returned to camp 1 yearlater. Each time, a serum sample was obtained from whicha determination of hemoglobin A1c (HgbA1c) was made.HgbA1c (also called glycosylated hemoglobin) is routinelyused to monitor compliance with taking insulin injections.Usually, the poorer the compliance, the higher the HgbA1clevel will be. The hypothesis is that the level HgbA1c isrelated to weight. The data in Table 11.28 were obtained. **5 Compute a rank correlation between change inweight and change in HgbA1c, each over 1 year. Use this measure to directly test the hypothesis that change in weight over 1 year is related to change in HgbA1c. Report a two-tailed p-value, and provide a 95% confidence interval for the underlying rank correlationDiabetesA group of 10-year-old boys were first ascertained in acamp for diabetic boys. They had their weight measuredat baseline and again when they returned to camp 1 yearlater. Each time, a serum sample was obtained from whicha determination of hemoglobin A1c (HgbA1c) was made.HgbA1c (also called glycosylated hemoglobin) is routinelyused to monitor compliance with taking insulin injections.Usually, the poorer the compliance, the higher the HgbA1clevel will be. The hypothesis is that the level HgbA1c isrelated to weight. The data in Table 11.28 were obtained.11.92 What test can be performed to assess the relationship between weight and HgbA1c at the initial visit?11.93 Please perform the test in Problem 11.92, and reporta two-tailed p-value.11.94 Do the results in Problem 11.93 imply a relationshipbetween change in HgbA1c and change in weight for anindividual boy? Why or why not?11.95 Compute a rank correlation between change inweight and change in HgbA1c, each over 1 year. Use this…TRUE or False 1)Logistic regression cannot be employed when the dependent variable is binary. 2)In the average linkage clustering, the distance between two clusters is defined as the average of distances between all pairs of objects, where each pair is made up of one object from each group. 3)As Monte Carlo simulation is essentially statistical sampling, the larger the number of trials used, the more precise is the result. 4)Monte Carlo simulation is an inappropriate tool to analyze cash budgets because of the inherent uncertainty of the sales forecasts on which most cash budgets are based 5)Any solution that satisfies all constraints of a problem is called a feasible solution..
- What is the MA3 forecast for Year 4, Q1? What is the weighted MA3 forecast for Year 4, Q1 with weights of 0.5, 0.33, and 0.17? What is the Exponential Smoothing forecast for Year 4, Q1 using alpha = 0.3? What is the Adjusted Exponential Smoothing forecast for Year 4, Q1 using alpha = 0.3 and beta = 0.5?To determine characteristics associated with Y = whether a cancer patient achieved remission (1 = yes), a study used logistic regression. The most important explanatory variable was a labeling index (LI) that measures proliferative activity of cells after a patient receives an injection of tritiated thymidine. It represents the percentage of cells that are “labeled.” Table 4.8 shows the grouped data. Software reports Table 4.9 for a logistic regression model using LI to predict π = P (Y = 1). A. Show how software obtained π ̂ = 0.068 when LI = 8. B. Show that π ̂ = 0.50 when LI = 26.0 D. The lower quartile and upper quartile for LI are 14 and 28. Show that π ̂ increases by 0.42, from 0.15 to 0.57, between those values. E. When LI increases by 1, show the estimated odds of remission multiply by 1.16Say you have a regression where you are regressing wages on several variables, one being Years of Education (X1). In this regression, you estimate βˆx1 = 1.5 and it is statistically significant. Suppose you then find there is information of individuals SAT scores (an approximate measure of underlying ability) and add it to your regression as X2. You now get that βˆx1 = 0.5 and is still statistically significant, and you get βˆx2 = 0.1 and it is also statistically significant. What type of relationship to you suspect there is between Years of Education, SAT scored, and wages? Touch on the correlation of each variable to every other variable and explain the likely causal pathways. If cor(x1, y) ≡ 0.5, and cor(x2, y) ≡ 0.5, explain when regressing y on x1 and x2 gives an R2 of 0.5
- A study used logistic regression to determine characteristics associated with Y = whether a cancer patient achieved remission (1 = yes). The most important explanatory variable was a labeling index (LI) that measures proliferative activity of cells after a patient receives an injection of tritiated thymidine. It represents the percentage of cells that are “labeled.” Table 1 shows the grouped data. Software reports Table 2 for a logistic regression model using LI to predict π = P(Y = 1). Using information from Table 2, conduct a Wald test for the LI effect and Interpret. Using information from Table 2, construct a Wald confidence interval for the odds ratio corresponding to a 1-unit increase in LI and interpret. Using information from Table 2, conduct a likelihood-ratio test for the LI effect and interpret. Using information from Table 2, construct the likelihood-ratio confidence interval for the odds ratio and interpret.A study used logistic regression to determine characteristics associated with Y = whether a cancer patient achieved remission (1 = yes). The most important explanatory variable was a labeling index (LI) that measures proliferative activity of cells after a patient receives an injection of tritiated thymidine. It represents the percentage of cells that are “labeled.” Table 1 shows the grouped data. Software reports Table 2 for a logistic regression model using LI to predict π = P(Y = 1). Show how software obtained = 0.068 when LI = 8. Show that = 0.50 when LI = 26.0. Show that the rate of change in is 0.009 when LI = 8 and is 0.036 when LI = 26. The lower quartile and upper quartile for LI are 14 and 28. Show that increases by 0.42, from 0.15 to 0.57, between those values. When LI increases by 1, show the estimated odds of remission multiply by 1.16. Using information from Table 2, conduct a Wald test for the LI effect. Interpret. Using information from Table 2, construct a Wald…For the snoring and heart disease data of Table 3.1 (Section 3.2.3) with snoring-levelscores (0, 2, 4, 5), the logistic regression ML fit is logit [Pˆ(Y = 1)] = −3.866 +0.397x. Interpret the effect of snoring on the odds of heart disease.

