kDa 245- 180. 140 100. 75. 60- 50 Loading Control 20- Leptin 15 10- Healthy Obese Obese + TE1 Obese + TE2 (Hypothetical immunoblot data for instruction/educational purposes only) Q.16 Based on the hypothetical blot above, was proper loading observed? Q.17 Assign intensity values (1-10) for each of the conditions above, then convert that to a bar chart by comparing it relative to "healthy" and paste it below (meaning divide each values to "healthy" value. Assume each value is the average for 3 trials so you could add error bars in your plot, and label it properly. I
kDa 245- 180. 140 100. 75. 60- 50 Loading Control 20- Leptin 15 10- Healthy Obese Obese + TE1 Obese + TE2 (Hypothetical immunoblot data for instruction/educational purposes only) Q.16 Based on the hypothetical blot above, was proper loading observed? Q.17 Assign intensity values (1-10) for each of the conditions above, then convert that to a bar chart by comparing it relative to "healthy" and paste it below (meaning divide each values to "healthy" value. Assume each value is the average for 3 trials so you could add error bars in your plot, and label it properly. I

Biochemistry
9th Edition
ISBN:9781319114671
Author:Lubert Stryer, Jeremy M. Berg, John L. Tymoczko, Gregory J. Gatto Jr.
Publisher:Lubert Stryer, Jeremy M. Berg, John L. Tymoczko, Gregory J. Gatto Jr.
Chapter1: Biochemistry: An Evolving Science
Section: Chapter Questions
Problem 1P

Related questions
Question
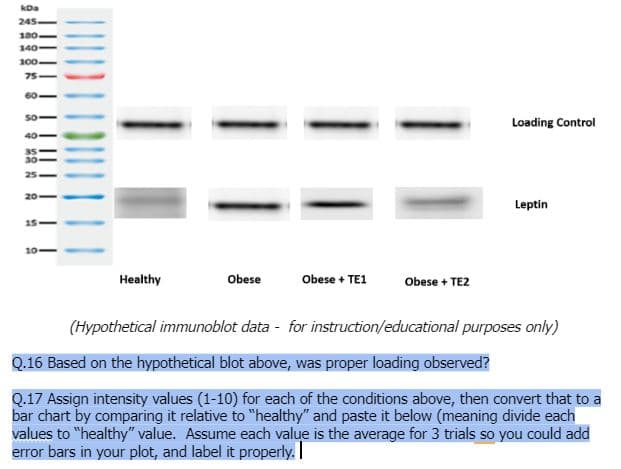
Transcribed Image Text:kDa
245-
180.
140
100.
75.
60.
50-
Loading Control
40
35
30
25.
20
Leptin
15
10
Healthy
Obese
Obese + TE1
Obese + TE2
(Hypothetical immunoblot data for instruction/educational purposes only)
Q.16 Based on the hypothetical blot above, was proper loading observed?
Q.17 Assign intensity values (1-10) for each of the conditions above, then convert that to a
bar chart by comparing it relative to "healthy" and paste it below (meaning divide each
values to "healthy" value. Assume each value is the average for 3 trials so you could add
error bars in your plot, and label it properly. I
Expert Solution
This question has been solved!
Explore an expertly crafted, step-by-step solution for a thorough understanding of key concepts.

Step by step
Solved in 3 steps with 2 images

Follow-up Questions
Read through expert solutions to related follow-up questions below.
Follow-up Question
Can you give a brief conclusion based on the hypothetical data obtained
Solution
Recommended textbooks for you
Biochemistry
Biochemistry
ISBN:
9781319114671
Author:
Lubert Stryer, Jeremy M. Berg, John L. Tymoczko, Gregory J. Gatto Jr.
Publisher:
W. H. Freeman

Lehninger Principles of Biochemistry
Biochemistry
ISBN:
9781464126116
Author:
David L. Nelson, Michael M. Cox
Publisher:
W. H. Freeman

Fundamentals of Biochemistry: Life at the Molecul…
Biochemistry
ISBN:
9781118918401
Author:
Donald Voet, Judith G. Voet, Charlotte W. Pratt
Publisher:
WILEY
Biochemistry
Biochemistry
ISBN:
9781319114671
Author:
Lubert Stryer, Jeremy M. Berg, John L. Tymoczko, Gregory J. Gatto Jr.
Publisher:
W. H. Freeman
Lehninger Principles of Biochemistry
Biochemistry
ISBN:
9781464126116
Author:
David L. Nelson, Michael M. Cox
Publisher:
W. H. Freeman
Fundamentals of Biochemistry: Life at the Molecul…
Biochemistry
ISBN:
9781118918401
Author:
Donald Voet, Judith G. Voet, Charlotte W. Pratt
Publisher:
WILEY

Biochemistry
Biochemistry
ISBN:
9781305961135
Author:
Mary K. Campbell, Shawn O. Farrell, Owen M. McDougal
Publisher:
Cengage Learning

Biochemistry
Biochemistry
ISBN:
9781305577206
Author:
Reginald H. Garrett, Charles M. Grisham
Publisher:
Cengage Learning

Fundamentals of General, Organic, and Biological …
Biochemistry
ISBN:
9780134015187
Author:
John E. McMurry, David S. Ballantine, Carl A. Hoeger, Virginia E. Peterson
Publisher:
PEARSON