
Physical Chemistry
2nd Edition
ISBN:9781133958437
Author:Ball, David W. (david Warren), BAER, Tomas
Publisher:Ball, David W. (david Warren), BAER, Tomas
Chapter6: Equilibria In Single-component Systems
Section: Chapter Questions
Problem 6.50E

Related questions
Question
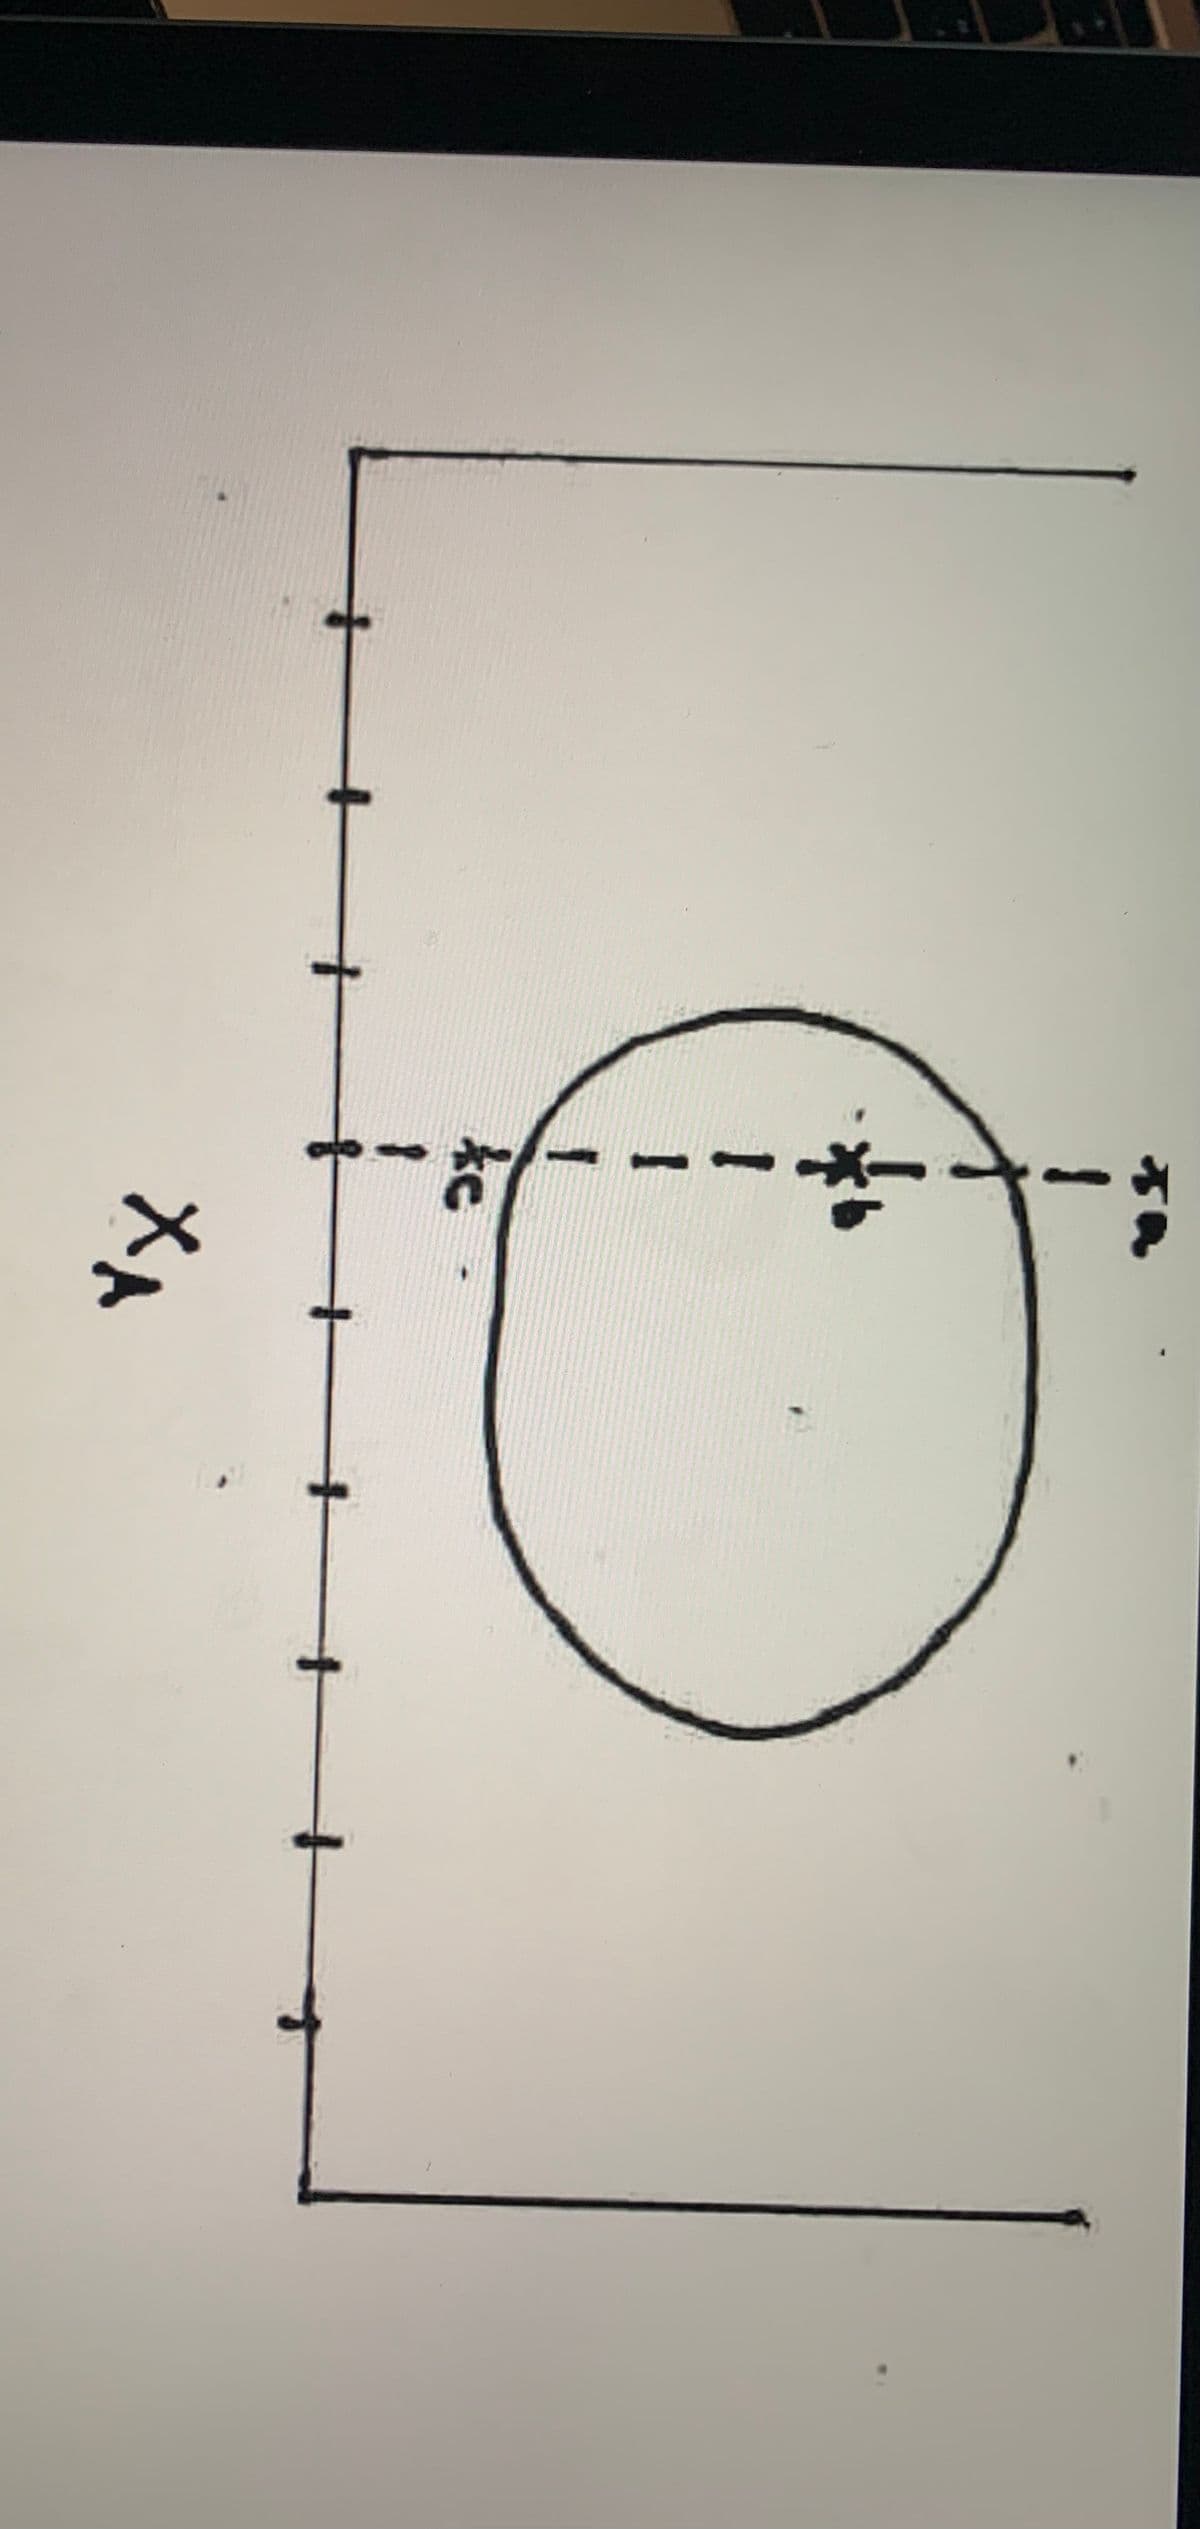
Can you interpret this graph. Normally on a temperature-composition phase diagram, there is a bubble and dew curve.
Transcribed Image Text:12, The following phase diagram is a temperature-composition diagram for two partially
miscible liquids A and B. At each labeled point on the diagram (a, b, and c) list the phases
present and estimate the approximate mole fraction of A and B in each.
Transcribed Image Text:ke
Expert Solution
This question has been solved!
Explore an expertly crafted, step-by-step solution for a thorough understanding of key concepts.

Step by step
Solved in 2 steps with 1 images

Knowledge Booster


Learn more about
Need a deep-dive on the concept behind this application? Look no further. Learn more about this topic, chemistry and related others by exploring similar questions and additional content below.Recommended textbooks for you
Physical Chemistry
Chemistry
ISBN:
9781133958437
Author:
Ball, David W. (david Warren), BAER, Tomas
Publisher:
Wadsworth Cengage Learning,

Introductory Chemistry: A Foundation
Chemistry
ISBN:
9781337399425
Author:
Steven S. Zumdahl, Donald J. DeCoste
Publisher:
Cengage Learning
Physical Chemistry
Chemistry
ISBN:
9781133958437
Author:
Ball, David W. (david Warren), BAER, Tomas
Publisher:
Wadsworth Cengage Learning,
Introductory Chemistry: A Foundation
Chemistry
ISBN:
9781337399425
Author:
Steven S. Zumdahl, Donald J. DeCoste
Publisher:
Cengage Learning