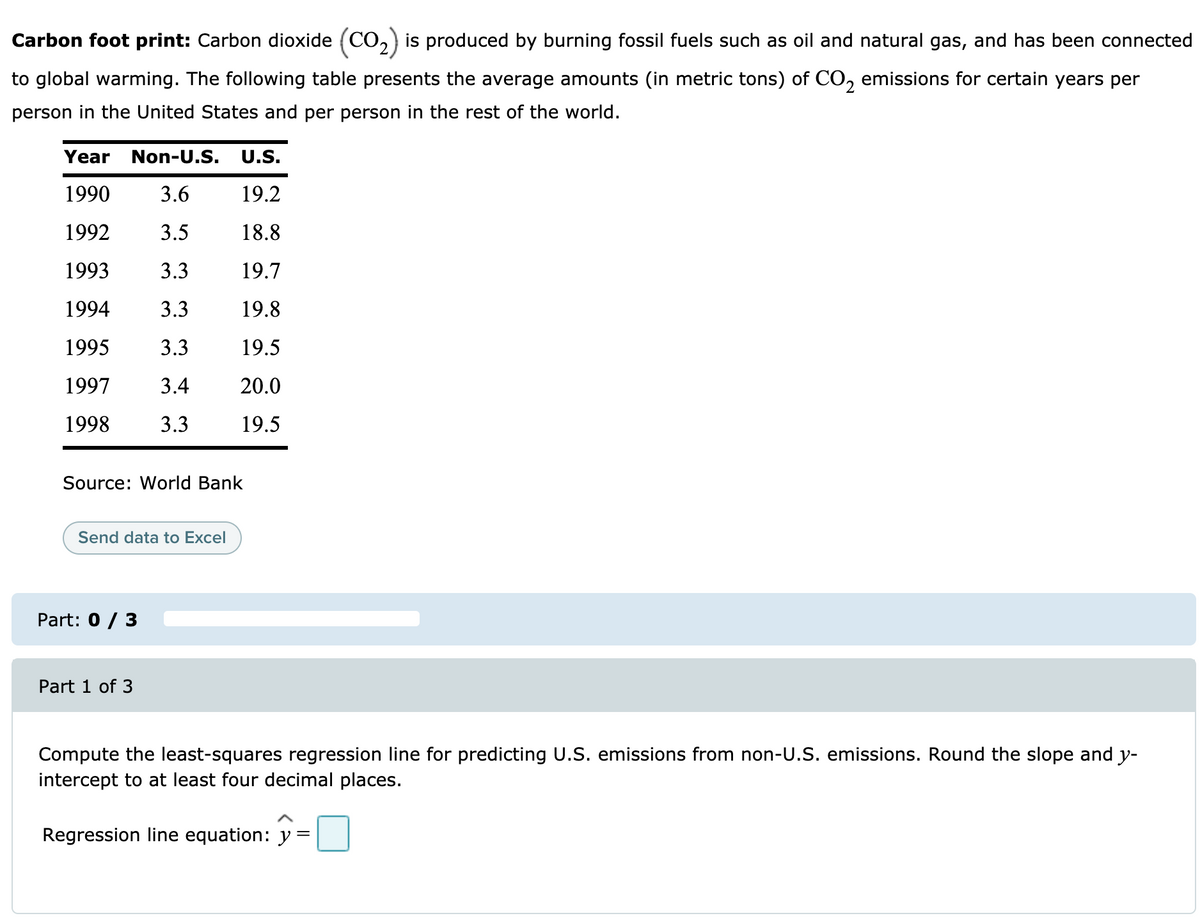
Carbon foot print: Carbon dioxide (CO,) is produced by burning fossil fuels such as oil and natural gas, and has been connected to global warming. The following table presents the average amounts (in metric tons) of CO, emissions for certain years per person in the United States and per person in the rest of the world. Year Non-U.S. U.S. 1990 3.6 19.2 1992 3.5 18.8 1993 3.3 19.7 1994 3.3 19.8 1995 3.3 19.5 1997 3.4 20.0 1998 3.3 19.5 Source: World Bank Send data to Excel Part: 0 / 3 Part 1 of 3 Compute the least-squares regression line for predicting U.S. emissions from non-U.S. emissions. Round the slope and y- intercept to at least four decimal places. Regression line equation: y =

Functions and Change: A Modeling Approach to College Algebra (MindTap Course List)
6th Edition
ISBN:9781337111348
Author:Bruce Crauder, Benny Evans, Alan Noell
Publisher:Bruce Crauder, Benny Evans, Alan Noell
Chapter5: A Survey Of Other Common Functions
Section5.1: Logistic Functions
Problem 14E: Long-Term Data and the Carrying Capacity This is a continuation of Exercise 13. Ideally, logistic...
icon
Related questions
icon
Concept explainers
Topic Video
Question
Carbon foot print: Carbon dioxide (CO, is produced by burning fossil fuels such as oil and natural gas, and has been connected
to global warming. The following table presents the average amounts (in metric tons) of CO, emissions for certain years per
person in the United States and per person in the rest of the world.
Year
Non-U.S.
U.S.
1990
3.6
19.2
1992
3.5
18.8
1993
3.3
19.7
1994
3.3
19.8
1995
3.3
19.5
1997
3.4
20.0
1998
3.3
19.5
Source: World Bank
Send data to Excel
Part: 0 / 3
Part 1 of 3
Compute the least-squares regression line for predicting U.S. emissions from non-U.S. emissions. Round the slope and y-
intercept to at least four decimal places.
Regression line equation: y =
Transcribed Image Text:Carbon foot print: Carbon dioxide (CO, is produced by burning fossil fuels such as oil and natural gas, and has been connected to global warming. The following table presents the average amounts (in metric tons) of CO, emissions for certain years per person in the United States and per person in the rest of the world. Year Non-U.S. U.S. 1990 3.6 19.2 1992 3.5 18.8 1993 3.3 19.7 1994 3.3 19.8 1995 3.3 19.5 1997 3.4 20.0 1998 3.3 19.5 Source: World Bank Send data to Excel Part: 0 / 3 Part 1 of 3 Compute the least-squares regression line for predicting U.S. emissions from non-U.S. emissions. Round the slope and y- intercept to at least four decimal places. Regression line equation: y =
Expert Solution
trending now

Trending now

This is a popular solution!

steps

Step by step

Solved in 2 steps with 3 images

Blurred answer
Knowledge Booster
Application of Algebra
Learn more about
Need a deep-dive on the concept behind this application? Look no further. Learn more about this topic, statistics and related others by exploring similar questions and additional content below.
Similar questions
Recommended textbooks for you
Functions and Change: A Modeling Approach to Coll…
Algebra
ISBN:
9781337111348
Author:
Bruce Crauder, Benny Evans, Alan Noell
Publisher:
Cengage Learning
Algebra and Trigonometry (MindTap Course List)
Algebra
ISBN:
9781305071742
Author:
James Stewart, Lothar Redlin, Saleem Watson
Publisher:
Cengage Learning
Linear Algebra: A Modern Introduction
Algebra
ISBN:
9781285463247
Author:
David Poole
Publisher:
Cengage Learning
College Algebra
College Algebra
Algebra
ISBN:
9781305115545
Author:
James Stewart, Lothar Redlin, Saleem Watson
Publisher:
Cengage Learning
Algebra & Trigonometry with Analytic Geometry
Algebra
ISBN:
9781133382119
Author:
Swokowski
Publisher:
Cengage
Glencoe Algebra 1, Student Edition, 9780079039897…
Algebra
ISBN:
9780079039897
Author:
Carter
Publisher:
McGraw Hill