Chapter 7: Parameter Estimation 39. The amount of beryllium in a substance is often determined by the use of a photometric filtration method. If the weight of the beryllium is u, then the value given by the photometric filtration method is normally distributed with mean u and standard deviation o. A total of eight independent measurements of 292 3.180 mg of beryllium gave the following results. 3.166, 3.192, 3.175, 3.180, 3.182, 3.171, 3.184, 3.177 Use the preceding data to (b) find a 90 percent confidence interval estimate of o. 40. If X1,...,X, is a sample from a normal population, explain how to obtain a 100(1-a) percent confidence interval for the population variance o when the population mean u is known. Explain in what sense knowledge of u improves (a) estimate o; the interval estimator compared with when it is unknown. Repeat Problem 38 if it is known that the mean burning time is 53.6 seconds. 41. A civil engineer wishes to measure the compressive strength of two differen s of concrete. A random sample of 10 specimens of the first type yielded the types following data (in psi) Type 1: 3,250, 3,268, 4,302, 3,184, 3,266 3,297, 3,332, 3,502, 3,064, 3,116 whereas a sample of 10 specimens of the second yielded the data Type 2: 3,094, 3,106, 3,004, 3,066, 2,984, 3,124, 3,316, 3,212, 3,380, 3,018 If we assume that the samples are normal with a common variance, determine (a) a 95 percent two-sided confidence interval for ui - u2, the difference in means; (b) a 95 percent one-sided upper confidence interval for u1 - u2; (c) a 95 percent one-sided lower confidence interval for u1 - 2. 42. Independent random samples are taken from the output of two machines on a production line. The weight of each item is of interest. From the first machine, a sample of size 36 is taken, with sample mean weight of 120 grams variance of 4. From the second machine, a sample of size 64 is taken, with a sample mean weight of 130 grams and a sample variance of 5. It is assumed that the weights of items from the first machine are normally distributed with mean lj and variance o and that the weights of items from the second machine are normally distributed with mean u2 and variance o2 (that is, the variances are assumed to be equal). Find a 99 percent confidence interval for u1 - H2, the and a sample g2 difference in population means.
Chapter 7: Parameter Estimation 39. The amount of beryllium in a substance is often determined by the use of a photometric filtration method. If the weight of the beryllium is u, then the value given by the photometric filtration method is normally distributed with mean u and standard deviation o. A total of eight independent measurements of 292 3.180 mg of beryllium gave the following results. 3.166, 3.192, 3.175, 3.180, 3.182, 3.171, 3.184, 3.177 Use the preceding data to (b) find a 90 percent confidence interval estimate of o. 40. If X1,...,X, is a sample from a normal population, explain how to obtain a 100(1-a) percent confidence interval for the population variance o when the population mean u is known. Explain in what sense knowledge of u improves (a) estimate o; the interval estimator compared with when it is unknown. Repeat Problem 38 if it is known that the mean burning time is 53.6 seconds. 41. A civil engineer wishes to measure the compressive strength of two differen s of concrete. A random sample of 10 specimens of the first type yielded the types following data (in psi) Type 1: 3,250, 3,268, 4,302, 3,184, 3,266 3,297, 3,332, 3,502, 3,064, 3,116 whereas a sample of 10 specimens of the second yielded the data Type 2: 3,094, 3,106, 3,004, 3,066, 2,984, 3,124, 3,316, 3,212, 3,380, 3,018 If we assume that the samples are normal with a common variance, determine (a) a 95 percent two-sided confidence interval for ui - u2, the difference in means; (b) a 95 percent one-sided upper confidence interval for u1 - u2; (c) a 95 percent one-sided lower confidence interval for u1 - 2. 42. Independent random samples are taken from the output of two machines on a production line. The weight of each item is of interest. From the first machine, a sample of size 36 is taken, with sample mean weight of 120 grams variance of 4. From the second machine, a sample of size 64 is taken, with a sample mean weight of 130 grams and a sample variance of 5. It is assumed that the weights of items from the first machine are normally distributed with mean lj and variance o and that the weights of items from the second machine are normally distributed with mean u2 and variance o2 (that is, the variances are assumed to be equal). Find a 99 percent confidence interval for u1 - H2, the and a sample g2 difference in population means.

MATLAB: An Introduction with Applications
6th Edition
ISBN:9781119256830
Author:Amos Gilat
Publisher:Amos Gilat
Chapter1: Starting With Matlab
Section: Chapter Questions
Problem 1P

Related questions

Concept explainers
Contingency Table
A contingency table can be defined as the visual representation of the relationship between two or more categorical variables that can be evaluated and registered. It is a categorical version of the scatterplot, which is used to investigate the linear relationship between two variables. A contingency table is indeed a type of frequency distribution table that displays two variables at the same time.
Binomial Distribution
Binomial is an algebraic expression of the sum or the difference of two terms. Before knowing about binomial distribution, we must know about the binomial theorem.
Topic Video
Question
pbm 41
Transcribed Image Text:Chapter 7: Parameter Estimation
39. The amount of beryllium in a substance is often determined by the use of a
photometric filtration method. If the weight of the beryllium is u, then the
value given by the photometric filtration method is normally distributed with
mean u and standard deviation o. A total of eight independent measurements of
292
3.180 mg of beryllium gave the following results.
3.166, 3.192, 3.175, 3.180, 3.182, 3.171, 3.184, 3.177
Use the preceding data to
(b) find a 90 percent confidence interval estimate of o.
40. If X1,...,X, is a sample from a normal population, explain how to obtain a
100(1-a) percent confidence interval for the population variance o when the
population mean u is known. Explain in what sense knowledge of u improves
(a) estimate o;
the interval estimator compared with when it is unknown.
Repeat Problem 38 if it is known that the mean burning time is 53.6 seconds.
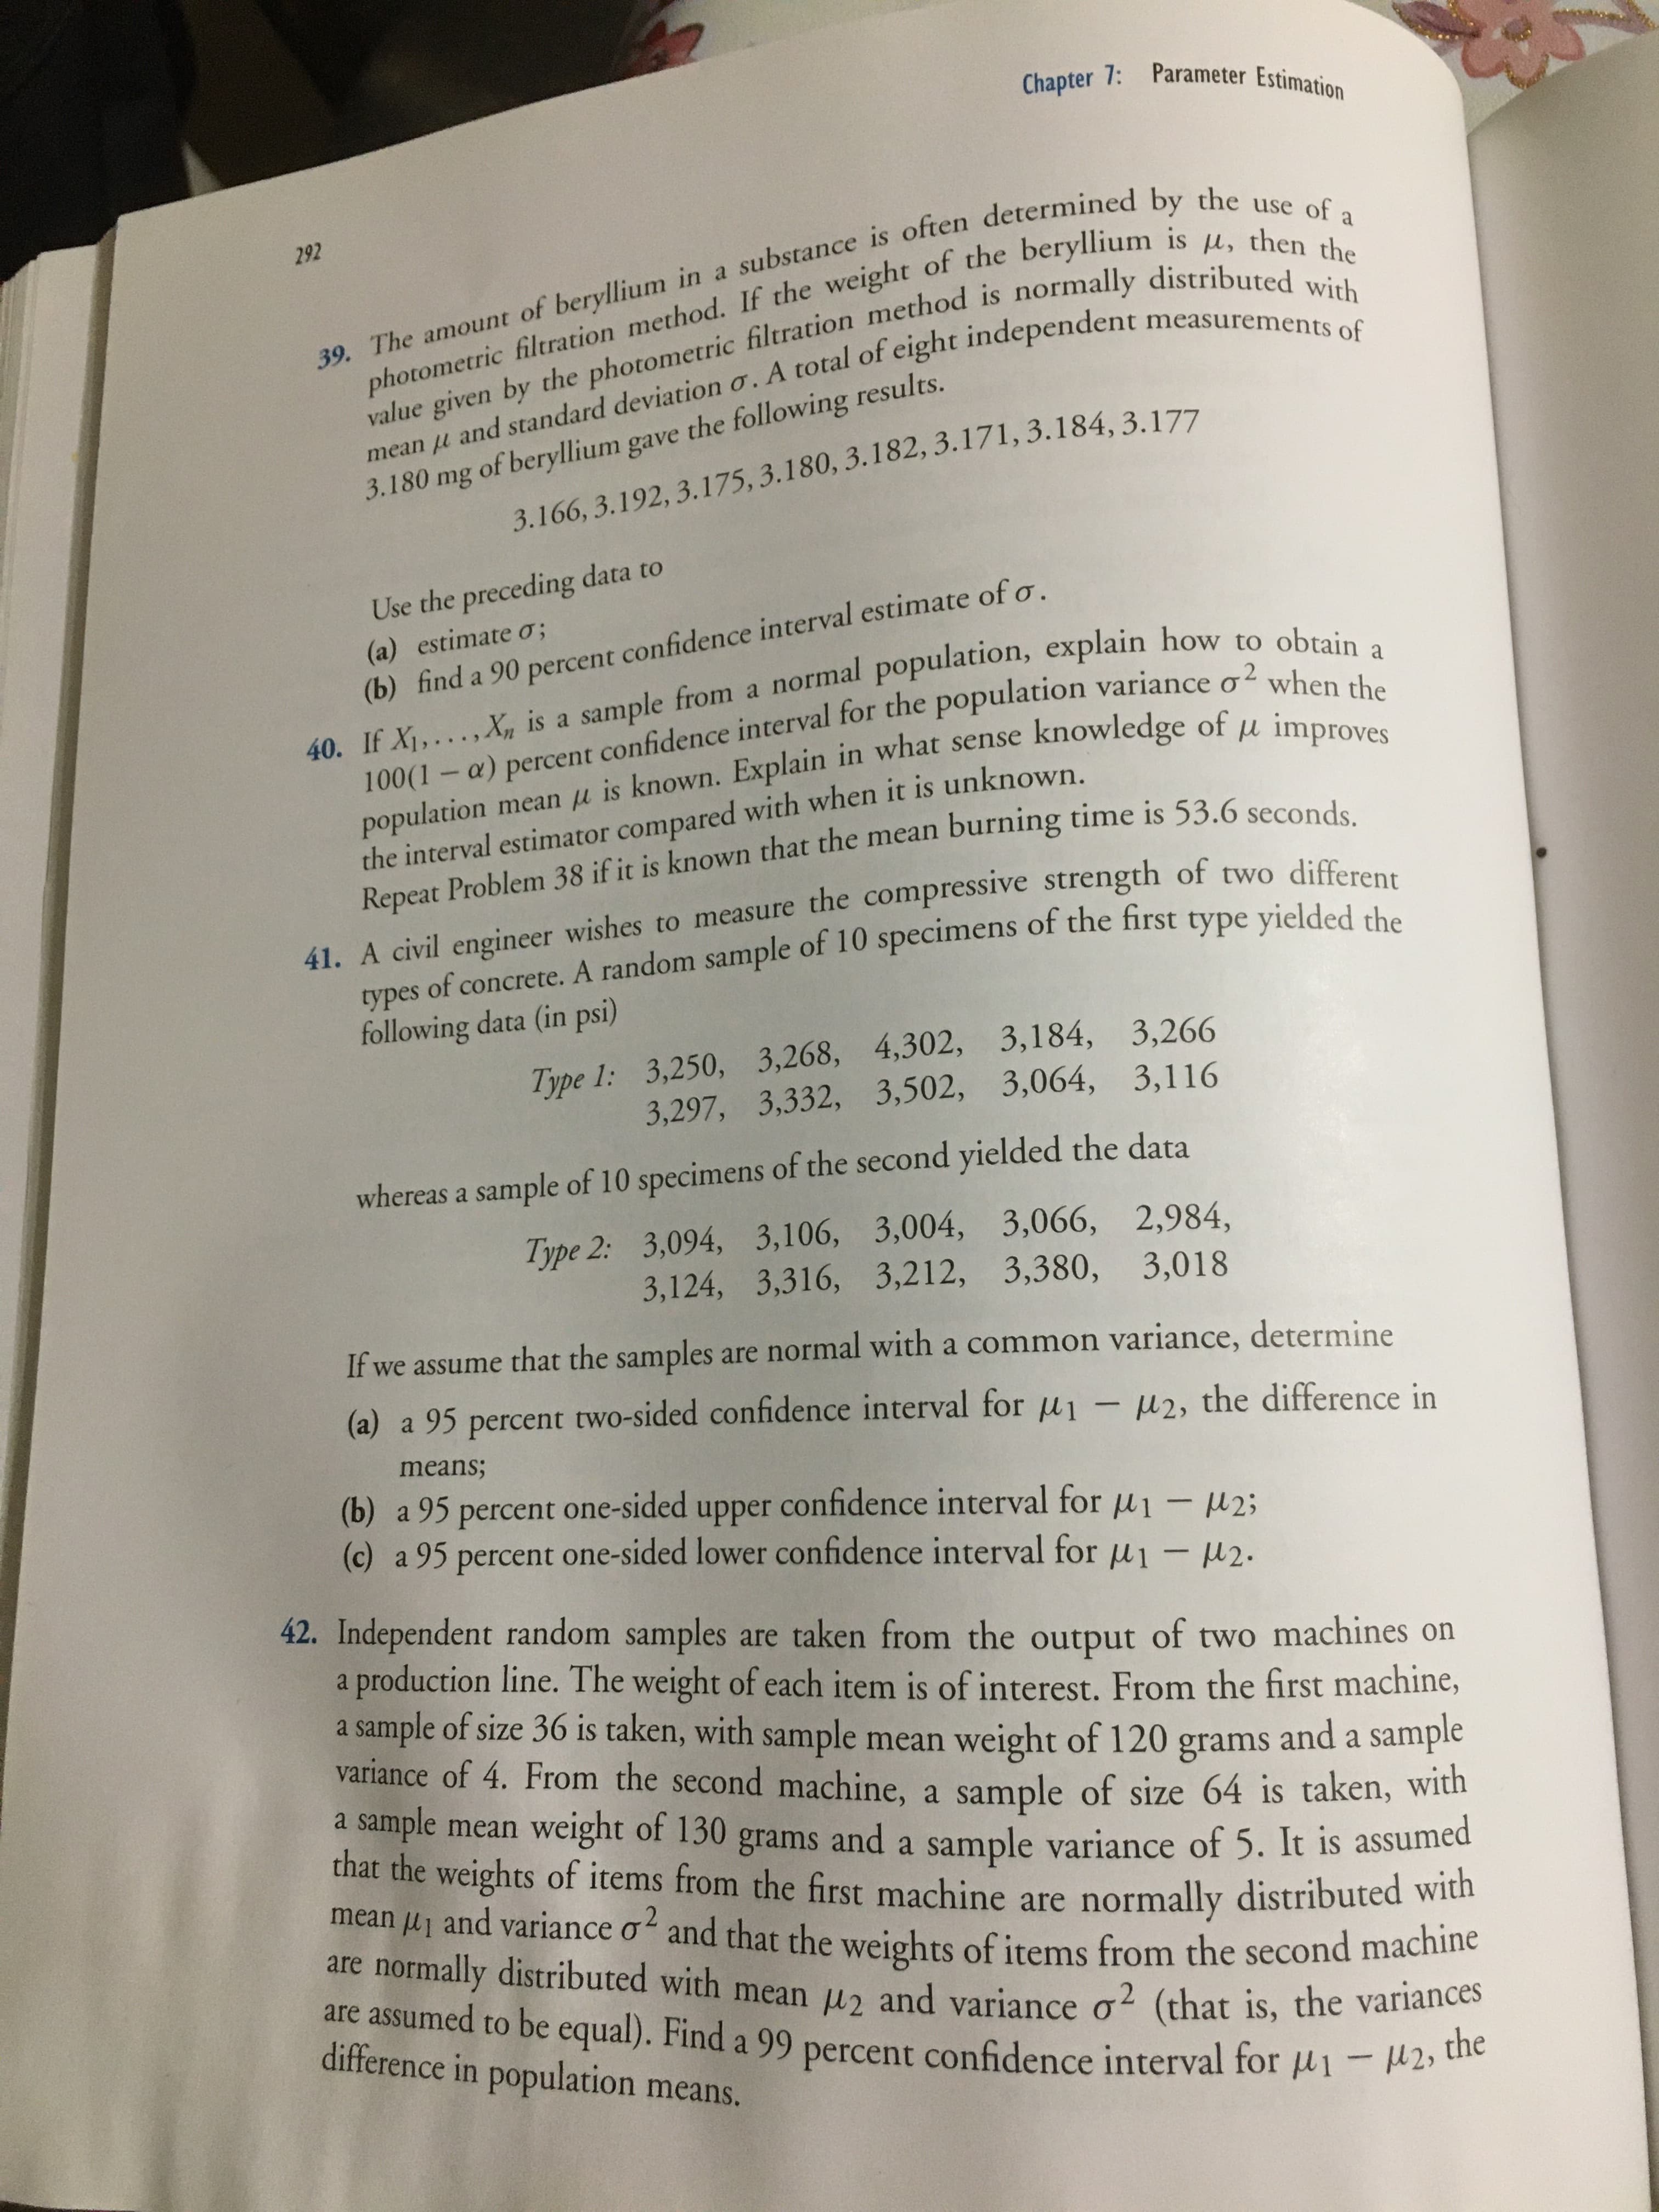
41. A civil engineer wishes to measure the compressive strength of two differen
s of concrete. A random sample of 10 specimens of the first type yielded the
types
following data (in psi)
Type 1: 3,250, 3,268, 4,302, 3,184, 3,266
3,297, 3,332, 3,502, 3,064, 3,116
whereas a sample of 10 specimens of the second yielded the data
Type 2: 3,094, 3,106, 3,004, 3,066, 2,984,
3,124, 3,316, 3,212, 3,380,
3,018
If we assume that the samples are normal with a common variance, determine
(a) a 95 percent two-sided confidence interval for ui - u2, the difference in
means;
(b) a 95 percent one-sided upper confidence interval for u1 - u2;
(c) a 95 percent one-sided lower confidence interval for u1 - 2.
42. Independent random samples are taken from the output of two machines on
a production line. The weight of each item is of interest. From the first machine,
a sample of size 36 is taken, with sample mean weight of 120 grams
variance of 4. From the second machine, a sample of size 64 is taken, with
a sample mean weight of 130 grams and a sample variance of 5. It is assumed
that the weights of items from the first machine are normally distributed with
mean lj and variance o and that the weights of items from the second machine
are normally distributed with mean u2 and variance o2 (that is, the variances
are assumed to be equal). Find a 99 percent confidence interval for u1 - H2, the
and a sample
g2
difference in population means.
Expert Solution
This question has been solved!
Explore an expertly crafted, step-by-step solution for a thorough understanding of key concepts.

This is a popular solution!

Trending now
This is a popular solution!

Step by step
Solved in 6 steps with 7 images

Knowledge Booster


Learn more about
Need a deep-dive on the concept behind this application? Look no further. Learn more about this topic, statistics and related others by exploring similar questions and additional content below.Recommended textbooks for you
MATLAB: An Introduction with Applications
Statistics
ISBN:
9781119256830
Author:
Amos Gilat
Publisher:
John Wiley & Sons Inc

Probability and Statistics for Engineering and th…
Statistics
ISBN:
9781305251809
Author:
Jay L. Devore
Publisher:
Cengage Learning

Statistics for The Behavioral Sciences (MindTap C…
Statistics
ISBN:
9781305504912
Author:
Frederick J Gravetter, Larry B. Wallnau
Publisher:
Cengage Learning
MATLAB: An Introduction with Applications
Statistics
ISBN:
9781119256830
Author:
Amos Gilat
Publisher:
John Wiley & Sons Inc
Probability and Statistics for Engineering and th…
Statistics
ISBN:
9781305251809
Author:
Jay L. Devore
Publisher:
Cengage Learning
Statistics for The Behavioral Sciences (MindTap C…
Statistics
ISBN:
9781305504912
Author:
Frederick J Gravetter, Larry B. Wallnau
Publisher:
Cengage Learning

Elementary Statistics: Picturing the World (7th E…
Statistics
ISBN:
9780134683416
Author:
Ron Larson, Betsy Farber
Publisher:
PEARSON

The Basic Practice of Statistics
Statistics
ISBN:
9781319042578
Author:
David S. Moore, William I. Notz, Michael A. Fligner
Publisher:
W. H. Freeman

Introduction to the Practice of Statistics
Statistics
ISBN:
9781319013387
Author:
David S. Moore, George P. McCabe, Bruce A. Craig
Publisher:
W. H. Freeman