
Chapter1: Making Economics Decisions
Section: Chapter Questions
Problem 1QTC

Related questions
Question
Compute the ratio of exports to imports for 2020 for each category.
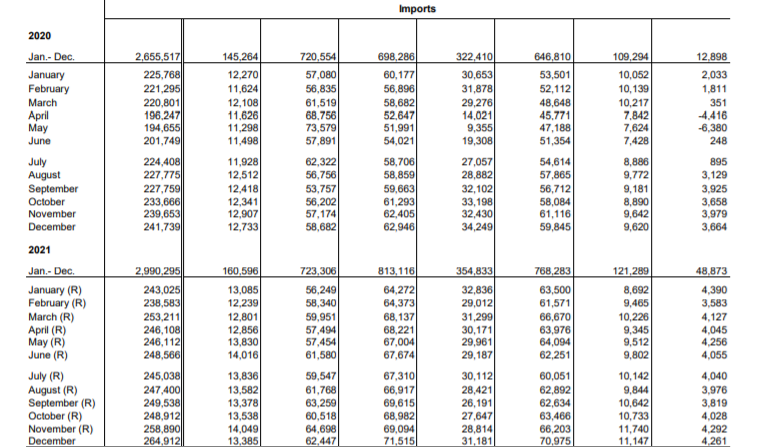
Transcribed Image Text:Imports
2020
Jan.- Dec.
2,655,517
225,768
221,295
220,801
196,247
194,655
201,749
145,264
720,554
698,286
322,410
646,810
109,294
12,898
57,080
60,177
56,896
58,682
52,647
30,653
31,878
29,276
14,021
9,355
19,308
January
February
12,270
53,501
10,052
2,033
10,139
10,217
7,842
11,624
56,835
52,112
1,811
61,519
68,756
73,579
57,891
March
April
May
June
12,108
11,626
11,298
11,498
48,648
45,771
47,188
51,354
351
-4,416
-6,380
248
51,991
7,624
54,021
7,428
224,408
227,775
227,759
233,666
239,653
241,739
62,322
56,756
58,706
58,859
59,663
61,293
62,405
62,946
July
11,928
27,057
54,614
57,865
56,712
58,084
61,116
59,845
8,886
9,772
895
August
September
October
November
28,882
32,102
33,198
32,430
34,249
12,512
3,129
12,418
3,925
53,757
56,202
57,174
9,181
12,341
12,907
12,733
8,890
9,642
9,620
3,658
3,979
December
58,682
3,664
2021
Jan.- Dec.
2,990,295
160,596
723,306
813,116
354,833
768,283
121,289
48,873
243,025
238,583
253,211
246,108
246,112
248,566
13,085
12,239
56,249
58,340
32,836
29,012
31,299
64,272
64,373
68,137
68,221
67,004
67,674
4,390
January (R)
February (R)
March (R)
April (R)
May (R)
June (R)
63,500
8,692
9,465
61,571
3,583
12,801
59,951
66,670
63,976
64,094
62,251
10,226
9,345
9,512
9,802
4,127
12,856
13,830
14,016
57,494
57,454
61,580
30,171
29,961
4,045
4,256
29,187
4,055
July (R)
August (R)
September (R)
October (R)
November (R)
December
245,038
247,400
249,538
248,912
258,890
264,912
67,310
66,917
69,615
68,982
69,094
71,515
13,836
59,547
30,112
60,051
10,142
4,040
61,768
63,259
60,518
64,698
62,447
13,582
13,378
28,421
26,191
62,892
62,634
63,466
66,203
70,975
9,844
10,642
10,733
11,740
3,976
3,819
27,647
28,814
31,181
13,538
4,028
14,049
13,385
4,292
4,261
11,147
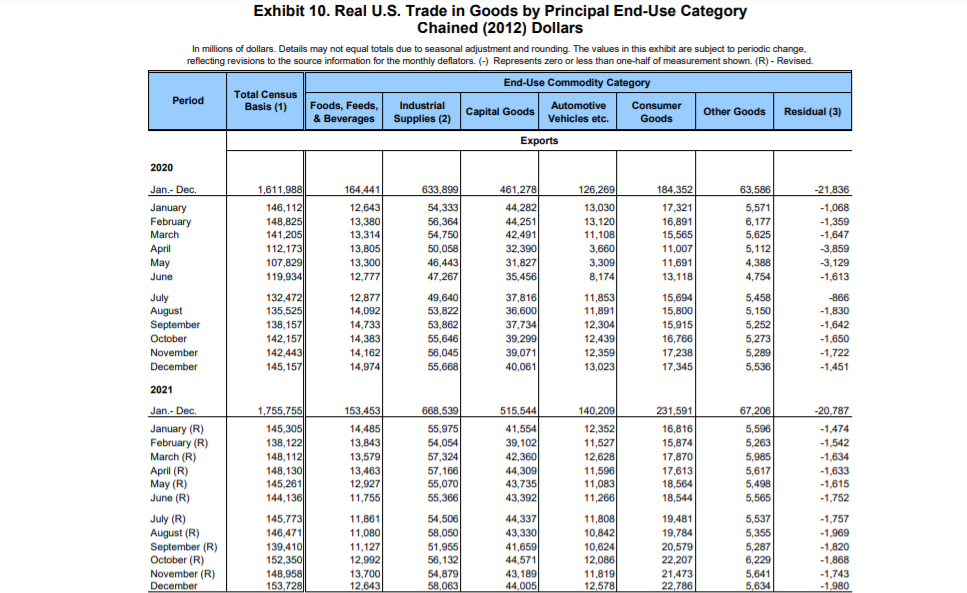
Transcribed Image Text:Exhibit 10. Real U.S. Trade in Goods by Principal End-Use Category
Chained (2012) Dollars
In millions of dollars. Details may not equal totals due to seasonal adjustment and rounding. The values in this exhibit are subject to periodic change,
reflecting revisions to the source information for the monthly deflators. (-) Represents zero or less than one-half of measurement shown. (R) - Revised.
End-Use Commodity Category
Total Census
Period
Consumer
Goods
Basis (1)
Foods, Feeds,
& Beverages Supplies (2)
Industrial
Automotive
Capital Goods
Other Goods
Residual (3)
Vehicles etc.
Exports
2020
Jan.- Dec.
1,611,988
164,441
633,899
461,278
126,269
184,352
63,586
-21,836
13,030
January
February
March
146,112
12,643
54,333
44,282
17,321
5,571
-1,068
148,825
141,205
112,173
107,829
119,934
44,251
-1,359
-1,647
13,380
56,364
54,750
50,058
13,120
16,891
6,177
13,314
42,491
11,108
15,565
5,625
32,390
April
May
13,805
3,660
11,007
5,112
-3,859
13,300
46,443
31,827
3,309
11,691
4,388
-3,129
June
12,777
47,267
35,456
8,174
13,118
4,754
-1,613
132,472
49,640
53,822
37,816
36,600
5,458
5,150
12,877
11,853
July
August
September
October
15,694
-866
135,525
14,092
11,891
15,800
-1,830
138,157
142,157
142,443
145,157
14,733
53,862
37,734
12,304
15,915
5,252
-1,642
55,646
56,045
16,766
17,238
14,383
39,299
12,439
12,359
5,273
-1,650
November
14,162
39,071
5,289
-1,722
December
14,974
55,668
40,061
13,023
17,345
5,536
-1,451
2021
Jan.- Dec
153,453
14,485
1,755,755
668,539
515,544
140,209
231,591
67,206
-20,787
55,975
January (R)
February (R)
March (R)
April (R)
May (R)
June (R)
145,305
41,554
5,596
12,352
11,527
16,816
-1,474
138,122
148,112
148,130
145,261
144,136
13,843
54,054
39,102
15,874
5,263
-1,542
13,579
12,628
11,596
11,083
11,266
57,324
42,360
17,870
5,985
-1,634
44,309
5,617
5,498
-1,633
-1,615
13,463
57,166
12,927
55,070
17,613
18,564
43,735
11,755
55,366
43,392
18,544
5,565
-1,752
145,773
146,471
139,410
152,350
148,958
153,728
54,506
58,050
51,955
July (R)
11,861
44,337
11,808
19,481
5,537
-1,757
11,080
43,330
41,659
19,784
20,579
22,207
10,842
-1,969
August (R)
September (R)
October (R)
November (R)
December
5,355
11,127
10,624
12,086
11,819
12,578
5,287
6,229
-1,820
12,992
56, 132
44,571
-1,868
13,700
54,879
58,063
43,189
44,005
21,473
22,786
5,641
5,634
-1,743
-1,980
12,643
Expert Solution
This question has been solved!
Explore an expertly crafted, step-by-step solution for a thorough understanding of key concepts.

This is a popular solution!

Trending now
This is a popular solution!

Step by step
Solved in 2 steps

Knowledge Booster


Learn more about
Need a deep-dive on the concept behind this application? Look no further. Learn more about this topic, economics and related others by exploring similar questions and additional content below.Recommended textbooks for you

Principles of Economics (12th Edition)
Economics
ISBN:
9780134078779
Author:
Karl E. Case, Ray C. Fair, Sharon E. Oster
Publisher:
PEARSON

Engineering Economy (17th Edition)
Economics
ISBN:
9780134870069
Author:
William G. Sullivan, Elin M. Wicks, C. Patrick Koelling
Publisher:
PEARSON
Principles of Economics (12th Edition)
Economics
ISBN:
9780134078779
Author:
Karl E. Case, Ray C. Fair, Sharon E. Oster
Publisher:
PEARSON
Engineering Economy (17th Edition)
Economics
ISBN:
9780134870069
Author:
William G. Sullivan, Elin M. Wicks, C. Patrick Koelling
Publisher:
PEARSON

Principles of Economics (MindTap Course List)
Economics
ISBN:
9781305585126
Author:
N. Gregory Mankiw
Publisher:
Cengage Learning

Managerial Economics: A Problem Solving Approach
Economics
ISBN:
9781337106665
Author:
Luke M. Froeb, Brian T. McCann, Michael R. Ward, Mike Shor
Publisher:
Cengage Learning

Managerial Economics & Business Strategy (Mcgraw-…
Economics
ISBN:
9781259290619
Author:
Michael Baye, Jeff Prince
Publisher:
McGraw-Hill Education