Consider a hypothetical economy in vihich households spend $0.50 of each additional dollar they earn and save the remaining $0.50. The follovwing graph shows the economy's initial aggregate-demand curve (AD1). Suppose the government increases its purchases by $5 billion. Use the green line (triangle symbol) on the following graph to show the aggregate-demand curve (AD2) after the multiplier effect takes place. Hint: Be sure the new aggregate-demand curve (AD2) is parallel to AD1. You can see the slope of AD, by selecting it on the following graph. 116 114 AD2 112 AD, 110 AD, 108 106 104 102 100 100 105 110 115 120 125 130 135 140 OUTPUT (Billions of dollars) PRICE LEVEL


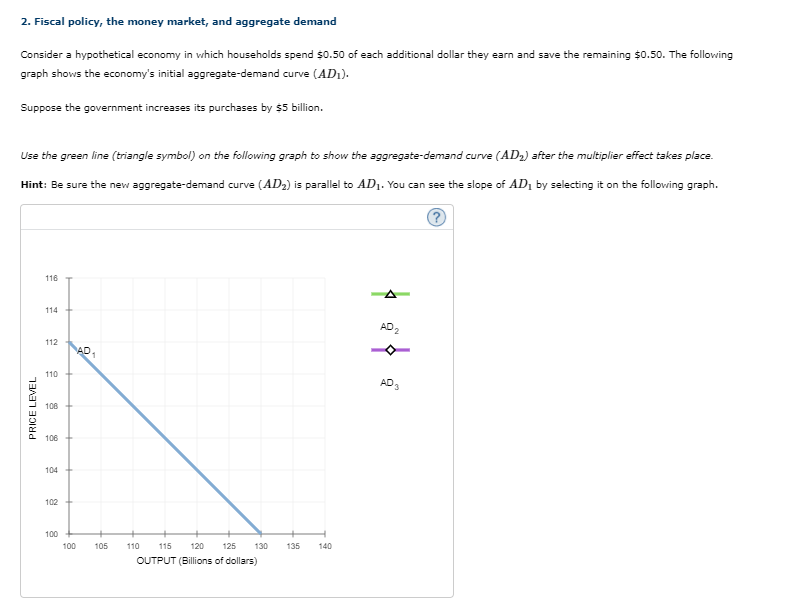
Consider a hypothetical economy in which households spend $0.50 of each additional dollar they earn and save the remaining $0.50. The following graph shows the economy's initial aggregate-
Suppose the government increases its purchases by $5 billion.
Use the green line (triangle symbol) on the following graph to show the aggregate-demand curve (AD2) after the multiplier effect takes place.
Hint: Be sure the new aggregate-demand curve (AD2) is parallel to AD1. You can see the slope of AD1 by selecting it on the following graph.
NOTE:
MAKE sure to adjust GRAPHS properly and plot the one that needs to have the new AGGRGATE demand curve plotted properly and MAKE SURE ITS EASY TO SEE AND READ PLEASE!!!!!!
NOTE: here are the blank question options
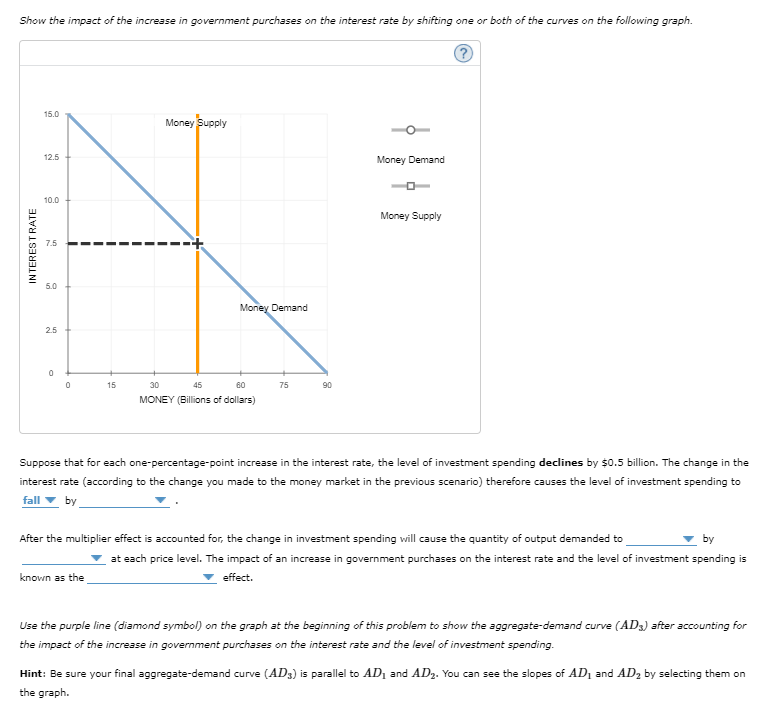
Suppose that for each one-percentage-point increase in the interest rate, the level of investment spending declines by $0.5 billion. The change in the interest rate (according to the change you made to the
After the multiplier effect is accounted for, the change in investment spending will cause the quantity of output demanded to ______ [increase or decrease] by _______ [1 billion or 2.5 billion or 1.2 billion] at each price level. The impact of an increase in government purchases on the interest rate and the level of investment spending is known as the ______ [liquitity effect or multiplier or crowding out or automatic stabalizer] effect
NOTE:
Use the purple line (diamond symbol) on the graph at the beginning of this problem to show the aggregate-demand curve (AD3) after accounting for the impact of the increase in government purchases on the interest rate and the level of investment spending.
Hint: Be sure your final aggregate-demand curve (AD3) is parallel to AD1 and AD2. You can see the slopes of AD1 and AD2 by selecting them on the graph.


Trending now
This is a popular solution!

Step by step
Solved in 2 steps with 1 images


