Consider a hypothetical economy in which the marginal propensity to consume (MPC) is 0.50. That is, if disposable income increases by $1, consumption increases by 50¢. Suppose further that last year disposable income in the economy was $400 billion and consumption was $300 billion. On the following graph, use the blue line (circle symbol) to plot this economy's consumption function based on these data. (Billions of dollars) 700 600 500 400 300 (?
Consider a hypothetical economy in which the marginal propensity to consume (MPC) is 0.50. That is, if disposable income increases by $1, consumption increases by 50¢. Suppose further that last year disposable income in the economy was $400 billion and consumption was $300 billion. On the following graph, use the blue line (circle symbol) to plot this economy's consumption function based on these data. (Billions of dollars) 700 600 500 400 300 (?

Chapter9: Aggregate Expenditures
Section: Chapter Questions
Problem 10E

Related questions
Question
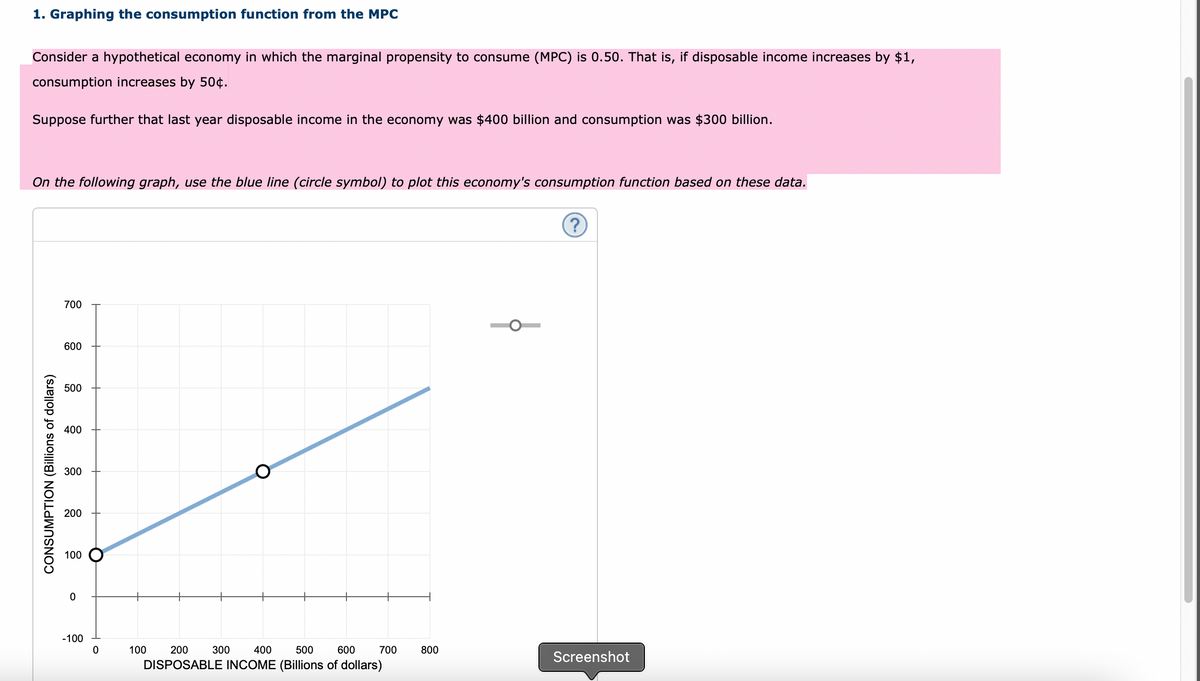
Transcribed Image Text:1. Graphing the consumption function from the MPC
Consider a hypothetical economy in which the marginal propensity to consume (MPC) is 0.50. That is, if disposable income increases by $1,
consumption increases by 50¢.
Suppose further that last year disposable income in the economy was $400 billion and consumption was $300 billion.
On the following graph, use the blue line (circle symbol) to plot this economy's consumption function based on these data.
CONSUMPTION (Billions of dollars)
700
600
500
400
300
200
100
0
-100
O
0
O
100
200 300 400 500
600
DISPOSABLE INCOME (Billions of dollars)
700
800
Screenshot

Transcribed Image Text:From the preceding data, you know that the level of savings in the economy last year was $
economy is
Suppose that this year, disposable income is projected to be $500 billion. Based on your analysis, you would expect consumption to be
billion and savings to be $
billion.
$
billion and the marginal propensity to save in this
Screenshot
Expert Solution
This question has been solved!
Explore an expertly crafted, step-by-step solution for a thorough understanding of key concepts.

This is a popular solution!

Trending now
This is a popular solution!

Step by step
Solved in 4 steps

Knowledge Booster


Learn more about
Need a deep-dive on the concept behind this application? Look no further. Learn more about this topic, economics and related others by exploring similar questions and additional content below.Recommended textbooks for you

Macroeconomics: Private and Public Choice (MindTa…
Economics
ISBN:
9781305506756
Author:
James D. Gwartney, Richard L. Stroup, Russell S. Sobel, David A. Macpherson
Publisher:
Cengage Learning

Economics: Private and Public Choice (MindTap Cou…
Economics
ISBN:
9781305506725
Author:
James D. Gwartney, Richard L. Stroup, Russell S. Sobel, David A. Macpherson
Publisher:
Cengage Learning
Macroeconomics: Private and Public Choice (MindTa…
Economics
ISBN:
9781305506756
Author:
James D. Gwartney, Richard L. Stroup, Russell S. Sobel, David A. Macpherson
Publisher:
Cengage Learning
Economics: Private and Public Choice (MindTap Cou…
Economics
ISBN:
9781305506725
Author:
James D. Gwartney, Richard L. Stroup, Russell S. Sobel, David A. Macpherson
Publisher:
Cengage Learning


Exploring Economics
Economics
ISBN:
9781544336329
Author:
Robert L. Sexton
Publisher:
SAGE Publications, Inc