Given the following quantities for a simple linear regression model results from a sample of sizen-8 observations: Σx-47.7,Σy = 315, Σ x ? 304.59, Σν2- 13527.0, Σxy = 1735.3 %3D %3D %3D a) Use the above information to calculate SSxy, SSyy, and SSxx- b) Use the quantities in a) above to calculate B, c) Calculate SSE and use it to calculate the estimated standard error of B1, s. d) Test Ho: B1 = 0 O against Ha:B, # 0 at a = 0.05 level of significance. %3D %3D
Given the following quantities for a simple linear regression model results from a sample of sizen-8 observations: Σx-47.7,Σy = 315, Σ x ? 304.59, Σν2- 13527.0, Σxy = 1735.3 %3D %3D %3D a) Use the above information to calculate SSxy, SSyy, and SSxx- b) Use the quantities in a) above to calculate B, c) Calculate SSE and use it to calculate the estimated standard error of B1, s. d) Test Ho: B1 = 0 O against Ha:B, # 0 at a = 0.05 level of significance. %3D %3D

Functions and Change: A Modeling Approach to College Algebra (MindTap Course List)
6th Edition
ISBN:9781337111348
Author:Bruce Crauder, Benny Evans, Alan Noell
Publisher:Bruce Crauder, Benny Evans, Alan Noell
Chapter5: A Survey Of Other Common Functions
Section5.6: Higher-degree Polynomials And Rational Functions
Problem 1TU: The following fictitious table shows kryptonite price, in dollar per gram, t years after 2006. t=...

Related questions
Question
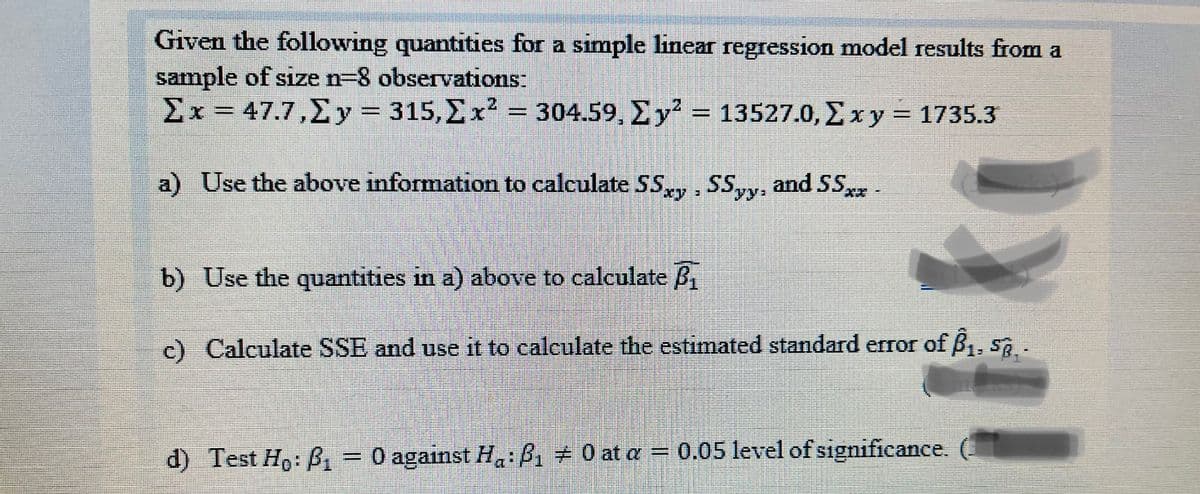
Transcribed Image Text:Given the following quantities for a simple linear regression model results from a
sample of size n-8 observations:
Σx- 47.7,Σy - 315, Σxλ -304.59, Σy? 135270, Σxy - 1735.3
%3D
a) Use the above information to calculate SS, SSyy, and SS-
yy:
b) Use the quantities in a) above to calculate B
c) Calculate SSE and use it to calculate the estimated standard error of B1, S.
d) Test Ho: B
O against H:B, 0 at a = 0.05 level of significance.
Expert Solution
This question has been solved!
Explore an expertly crafted, step-by-step solution for a thorough understanding of key concepts.

This is a popular solution!

Trending now
This is a popular solution!

Step by step
Solved in 4 steps

Knowledge Booster


Learn more about
Need a deep-dive on the concept behind this application? Look no further. Learn more about this topic, statistics and related others by exploring similar questions and additional content below.Recommended textbooks for you
Functions and Change: A Modeling Approach to Coll…
Algebra
ISBN:
9781337111348
Author:
Bruce Crauder, Benny Evans, Alan Noell
Publisher:
Cengage Learning
Functions and Change: A Modeling Approach to Coll…
Algebra
ISBN:
9781337111348
Author:
Bruce Crauder, Benny Evans, Alan Noell
Publisher:
Cengage Learning