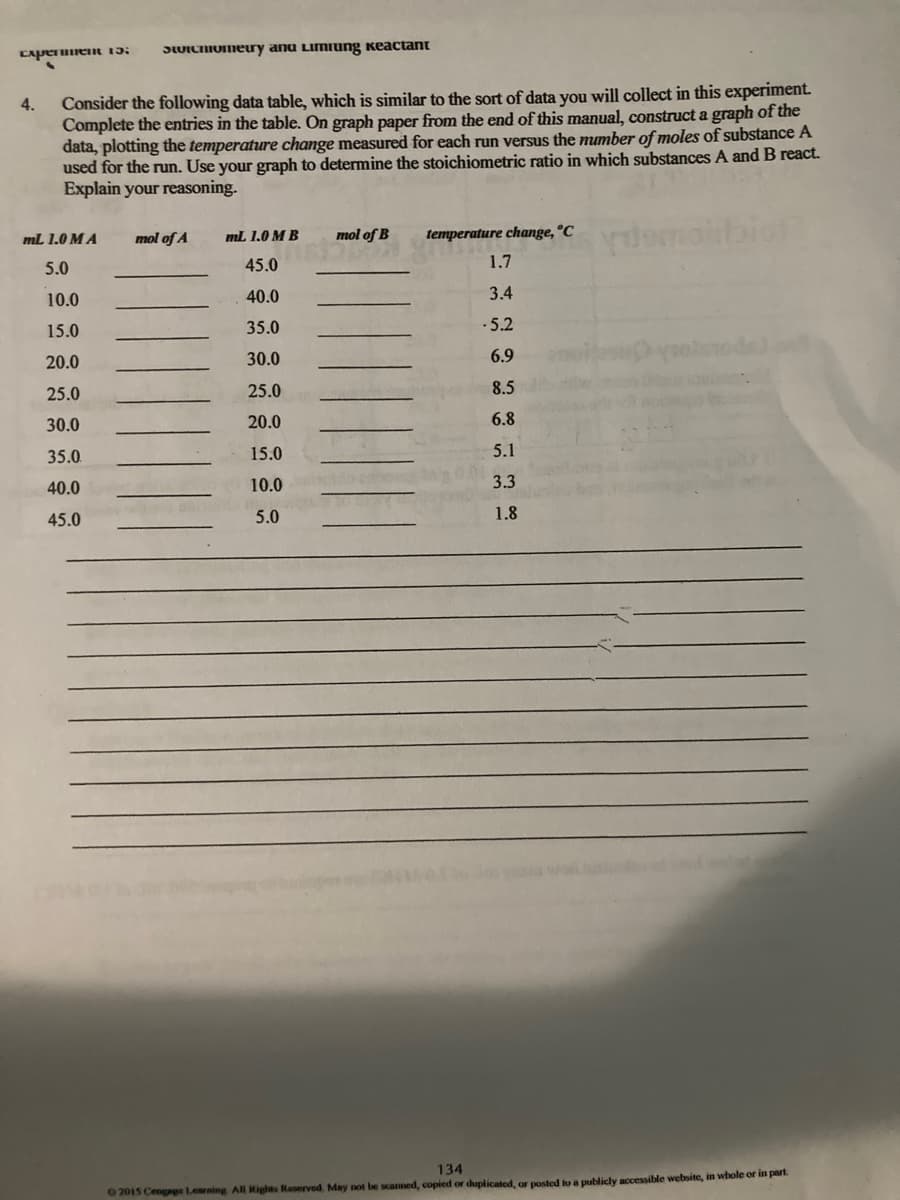
Consider the following data table, which is similar to the sort of data you will collect in this experiment. Complete the entries in the table. On graph paper from the end of this manual, construct a graph of the data, plotting the temperature change measured for each run versus the mumber of moles of substance A used for the run. Use your graph to determine the stoichiometric ratio in which substances A and B react. Explain your reasoning. 4. mL 1.0 MA mol of A mL 1.0 MB mol of B temperature change, °C 5.0 45.0 1.7 10.0 40.0 3.4 15.0 35.0 ·5.2 20.0 30.0 6.9 25.0 25.0 8.5 30.0 20.0 6.8 35.0 15.0 5.1 40.0 10.0 3.3 45.0 5.0 1.8


Ideal and Real Gases
Ideal gases obey conditions of the general gas laws under all states of pressure and temperature. Ideal gases are also named perfect gases. The attributes of ideal gases are as follows,
Gas Laws
Gas laws describe the ways in which volume, temperature, pressure, and other conditions correlate when matter is in a gaseous state. The very first observations about the physical properties of gases was made by Robert Boyle in 1662. Later discoveries were made by Charles, Gay-Lussac, Avogadro, and others. Eventually, these observations were combined to produce the ideal gas law.
Gaseous State
It is well known that matter exists in different forms in our surroundings. There are five known states of matter, such as solids, gases, liquids, plasma and Bose-Einstein condensate. The last two are known newly in the recent days. Thus, the detailed forms of matter studied are solids, gases and liquids. The best example of a substance that is present in different states is water. It is solid ice, gaseous vapor or steam and liquid water depending on the temperature and pressure conditions. This is due to the difference in the intermolecular forces and distances. The occurrence of three different phases is due to the difference in the two major forces, the force which tends to tightly hold molecules i.e., forces of attraction and the disruptive forces obtained from the thermal energy of molecules.


Trending now
This is a popular solution!

Step by step
Solved in 2 steps with 1 images


