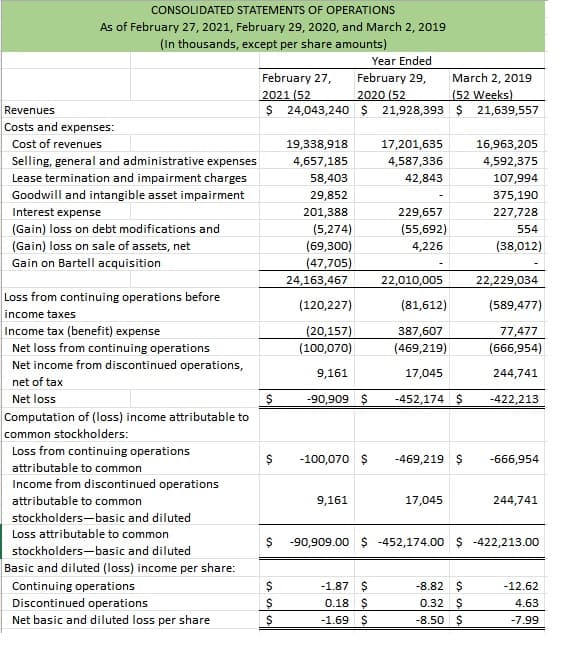
CONSOLIDATED STATEMENTS OF OPERATIONS As of February 27, 2021, February 29, 2020, and March 2, 2019 (In thousands, except per share amounts) Year Ended February 29, 2020 (52 $ 24,043,240 Ş 21,928,393 $ 21,639,557 February 27, March 2, 2019 2021 (52 (52 Weeks) Revenues Costs and expenses: Cost of revenues 19,338,918 17,201,635 16,963,205 Selling, general and administrative expenses Lease termination and impairment charges Goodwill and intangible asset impairment 4,657,185 4,587,336 4,592,375 58,403 42,843 107,994 29,852 375,190 227,728 Interest expense 201,388 229,657 (Gain) loss on debt modifications and (Gain) loss on sale of assets, net Gain on Bartell acquisition (5,274) (69,300) (55,692) 554 4,226 (38,012) (47,705) 24,163,467 22,010,005 22,229,034 Loss from continuing operations before (120,227) (81,612) (589,477) income taxes Income tax (benefit) expense Net loss from continuing operations Net income from discontinued operations, (20,157) (100,070) 387,607 77,477 (469,219) (666,954) 9,161 17,045 244,741 net of tax Net loss -90,909 $ -452,174 $ -422,213 Computation of (loss) income attributable to common stockholders: Loss from continuing operations $ -100,070 $ -469,219 $ -666,954 attributable to common Income from discontinued operations attributable to common 9,161 17,045 244,741 stockholders-basic and diluted Loss attributable to common $ - 90,909.00 -452,174.00 $ -422,213.00 stockholders-basic and diluted Basic and diluted (loss) income per share: Continuing operations -1.87 $ -8.82 $ -12.62 Discontinued operations 0.18 $ 0.32 $ 4.63 Net basic and diluted loss per share -1.69 $ -8.50 $ -7.99 %24
CONSOLIDATED STATEMENTS OF OPERATIONS As of February 27, 2021, February 29, 2020, and March 2, 2019 (In thousands, except per share amounts) Year Ended February 29, 2020 (52 $ 24,043,240 Ş 21,928,393 $ 21,639,557 February 27, March 2, 2019 2021 (52 (52 Weeks) Revenues Costs and expenses: Cost of revenues 19,338,918 17,201,635 16,963,205 Selling, general and administrative expenses Lease termination and impairment charges Goodwill and intangible asset impairment 4,657,185 4,587,336 4,592,375 58,403 42,843 107,994 29,852 375,190 227,728 Interest expense 201,388 229,657 (Gain) loss on debt modifications and (Gain) loss on sale of assets, net Gain on Bartell acquisition (5,274) (69,300) (55,692) 554 4,226 (38,012) (47,705) 24,163,467 22,010,005 22,229,034 Loss from continuing operations before (120,227) (81,612) (589,477) income taxes Income tax (benefit) expense Net loss from continuing operations Net income from discontinued operations, (20,157) (100,070) 387,607 77,477 (469,219) (666,954) 9,161 17,045 244,741 net of tax Net loss -90,909 $ -452,174 $ -422,213 Computation of (loss) income attributable to common stockholders: Loss from continuing operations $ -100,070 $ -469,219 $ -666,954 attributable to common Income from discontinued operations attributable to common 9,161 17,045 244,741 stockholders-basic and diluted Loss attributable to common $ - 90,909.00 -452,174.00 $ -422,213.00 stockholders-basic and diluted Basic and diluted (loss) income per share: Continuing operations -1.87 $ -8.82 $ -12.62 Discontinued operations 0.18 $ 0.32 $ 4.63 Net basic and diluted loss per share -1.69 $ -8.50 $ -7.99 %24
Intermediate Accounting: Reporting And Analysis
3rd Edition
ISBN:9781337788281
Author:James M. Wahlen, Jefferson P. Jones, Donald Pagach
Publisher:James M. Wahlen, Jefferson P. Jones, Donald Pagach
Chapter5: The Income Statement And The Statement Of Cash Flows
Section: Chapter Questions
Problem 2P
Related questions
Question
| Quick Ratio |
| Leverage Ratio |
| Debt to Total Assets Ratio |
| Debt Equity Ratio |
| Long-Term Debt to Equity |
| Times Interest Earned Ratio |
| Activity Ratios |
| Inventory Turnover |
| Fixed Assets Turnover |
| Total Assets Turnover |
| Average Collection Period |
| Profitability Ratios |
| Gross Profit Margin |
| Operating Profit Margin |
| Net Profit Margin |
| Return on Total Assets (ROA) |
| Return on |
| Earnings Per Share (EPS) |
| Price Earnings Ratio |
Please provide the numbers for the ratios.

Transcribed Image Text:CONSOLIDATED STATEMENTS OF OPERATIONS
As of February 27, 2021, February 29, 2020, and March 2, 2019
(In thousands, except per share amounts)
Year Ended
February 27,
February 29,
2020 (52
$ 24,043,240 $ 21,928,393 $ 21,639,557
March 2, 2019
2021 (52
(52 Weeks)
Revenues
Costs and expenses:
Cost of revenues
19,338,918
17,201,635
16,963,205
Selling, general and administrative expenses
4,657,185
4,587,336
4,592,375
Lease termination and impairment charges
58,403
42,843
107,994
Goodwill and intangible asset impairment
29,852
375,190
229,657
Interest expense
(Gain) loss on debt modifications and
201,388
227,728
(5,274)
(55,692)
554
(Gain) loss on sale of assets, net
(69,300)
4,226
(38,012)
Gain on Bartell acquisition
(47,705)
24,163,467
22,010,005
22,229,034
Loss from continuing operations before
(120,227)
(81,612)
(589,477)
income taxes
Income tax (benefit) expense
(20,157)
387,607
77,477
Net loss from continuing operations
Net income from discontinued operations,
(100,070)
(469,219)
(666,954)
9,161
17,045
244,741
net of tax
Net loss
-90,909 $
-452,174 $
-422,213
Computation of (loss) income attributable to
common stockholders:
Loss from continuing operations
-100,070 $
-469,219 $
-666,954
attributable to common
Income from discontinued operations
attributable to common
9,161
17,045
244,741
stockholders-basic and diluted
Loss attributable to common
-90,909.00 $ -452,174.00 $ -422,213.00
stockholders-basic and diluted
Basic and diluted (loss) income per share:
-1.87 $
0.18 $
Continuing operations
-8.82
-12.62
Discontinued operations
0.32
4.63
Net basic and diluted loss per share
-1.69 $
-8.50 $
-7.99

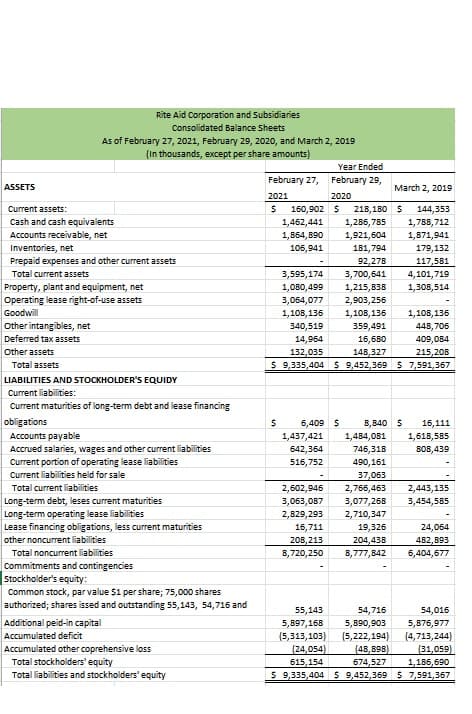
Transcribed Image Text:Rite Aid Corporation and Subsidiaries
Consolidated Balance Sheets
As of February 27, 2021, February 29, 2020, and March 2, 2019
(In thousands, except per share amounts)
Year Ended
February 27, February 29,
ASSETS
March 2, 2019
2021
2020
Current assets:
$ 160,902S
218,180 S
144,353
Cash and cash equivalents
Accounts receivable, net
Inventories, net
Prepaid expenses and other current assets
1,462,441
1,286,785
1,788,712
1,864, 890
1,921,604
1,871,941
105,941
181,794
179,132
92,278
117,581
4,101,719
1,308,514
Total current assets
3,595,174
3,700,641
Property, plant and equipment, net
Operating lease right-of-use assets
Goodwill
1,080,499
1,215,838
3,064,077
2,903,256
1,108,136
1,108,136
1,108,136
Other intangibles, net
Deferred tax assets
340,519
359,491
448, 706
14,964
16,680
409,084
Other assets
148,327
$ 9,335,404 $ 9,452,369 $ 7,591,367
132,035
215,208
Total assets
LIABILITIES AND STOCKHOLDER'S EQUIDY
Current liabilities:
Current maturities of long-term debt and lease financing
obligations
Accounts payable
Accrued salaries, wages and other current liabilities
Current portion of operating lease liabilities
6,409 $
1,437,421
8,840 S
16,111
1,484,081
1,618,585
642,364
746,318
BOB,439
516,752
490,161
Current liabilities held for sale
37,063
Total current liabilities
2,602,945
2,766,453
2,443,135
Long-term debt, leses current maturities
Long-term operating lease liabilities
Lease financing obligations, less current maturities
other noncurrent liabilities
Total noncurrent liabilities
3,063,087
3,077,268
3,454,585
2,829,293
2,710,347
16,711
19,326
24,064
208,213
204,438
482,693
8,720,250
8,777,842
6,404,677
Commitments and contingencies
Stockholder's equity:
Common stock, par value $1 per share; 75,000 shares
authorized; shares issed and outstanding 55,143, 54,716 and
55,143
54,716
54,016
Additional peid-in capital
5,876,977
(4,713,244)
5,897,168
5,890,903
Accumulated deficit
(5,313,103)
(5,222,194)
Accumulated other coprehensive loss
Total stockholders' equity
Total liabilities and stockholders' equity
(48,898)
674,527
$ 9,335,404 $ 9,452,369 S 7,591,367
(24,054)
615,154
(31,059)
1,185,690
Expert Solution
This question has been solved!
Explore an expertly crafted, step-by-step solution for a thorough understanding of key concepts.
This is a popular solution!
Trending now
This is a popular solution!
Step by step
Solved in 2 steps with 1 images

Knowledge Booster
Learn more about
Need a deep-dive on the concept behind this application? Look no further. Learn more about this topic, accounting and related others by exploring similar questions and additional content below.Recommended textbooks for you

Intermediate Accounting: Reporting And Analysis
Accounting
ISBN:
9781337788281
Author:
James M. Wahlen, Jefferson P. Jones, Donald Pagach
Publisher:
Cengage Learning

Cornerstones of Financial Accounting
Accounting
ISBN:
9781337690881
Author:
Jay Rich, Jeff Jones
Publisher:
Cengage Learning


Intermediate Accounting: Reporting And Analysis
Accounting
ISBN:
9781337788281
Author:
James M. Wahlen, Jefferson P. Jones, Donald Pagach
Publisher:
Cengage Learning

Cornerstones of Financial Accounting
Accounting
ISBN:
9781337690881
Author:
Jay Rich, Jeff Jones
Publisher:
Cengage Learning


Principles of Accounting Volume 1
Accounting
ISBN:
9781947172685
Author:
OpenStax
Publisher:
OpenStax College