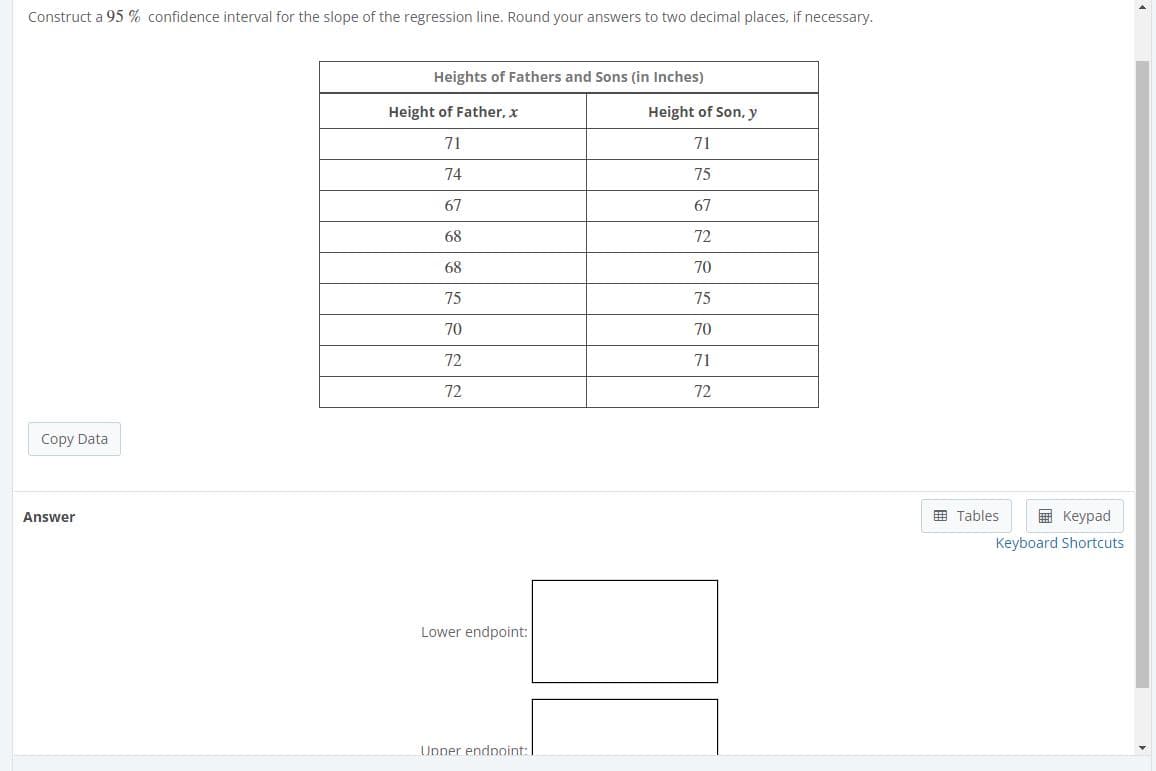
Construct a 95 % confidence interval for the slope of the regression line. Round your answers to two decimal places, if necessary. Heights of Fathers and Sons (in Inches) Height of Father, x Height of Son, y 71 71 74 75 67 67 68 72 68 70 75 75 70 70 72 71 72 72 Copy Data 囲 Tables E Keypad Answer Keyboard Shortcuts Lower endpoint: Unner endnoint:


Q: A teacher conducted a regression analysis to investigate the relationship between student height and…
A: df = n- 2 = 24-2 = 22 __________________________ Given (1-α)100% = 99.5%
Q: Below is the output for the regression analysis for percent of birth to teenage mothers (y) and ACT…
A: From the output, the slope is -1.65 and the intercept is 45.76.
Q: The table below lists weights (carats) and prices (dollars) of randomly selected diamonds. Find the…
A: Therefore, based on the sample data provided, it is found that the coefficient of determination is…
Q: Assume you have noted the following prices for books and the number of pages that each book…
A: 1 The regression output for the given dataset, as obtained in excel, is as follows:…
Q: Use the set of points to compute the following. The slope of the regression line for this data is…
A: Solution-: Given: b1=-0.4648187, SEb=0.2566363 We find the 99% critical value=?
Q: a) Write out the regression equation. b) Fill in the missing values *, **, *** and ****. c) Use the…
A: The study is about the relationship between the prices of houses, how many bedrooms, House size in…
Q: WHat is the confidence interval? Consider the following data on x = rainfall volume (m3) and y =…
A:
Q: Given this information, the calculated test statistic for the regression slope coefficient on the…
A: True(Verdadero). Test statistic=estimate of the variable/SE
Q: 00 600 700 750 Y= Power of a Diesel engine (hp) 580 1030 1420 1880 2100
A: Let us define the independent (X) and dependent (Y) first. Let , X be Revolution per minuets…
Q: Given below are seven observations collected in a regression study on two variables, x (independent…
A: Solution To find the correlation coefficient we will use Excel
Q: What is the equation of the regression line?
A: Answer:
Q: Jse the set of points to compute the following. The slope of the regression line for this data is…
A:
Q: Given are five observations for two variables, and . Excel File: data14-25.xlsx 2 6 9 13 20 x…
A: Estimating regression equation: Software procedure for regression in EXCEL. Enter the given data in…
Q: The Table below summaries to model the relationship between a company sale and the sales for the…
A: Given - X Y X2 Y2 X*Y 10 0.5 100 0.25 5 12 1 144 1 12 13 1 169 1 13 15 1.4 225 1.96 21…
Q: Listed below are amounts of court income and salaries paid to the town justices for a certain town.…
A: Given data, Court_Income Justice_Salary 68 31 415 47 1592 95 1150 52…
Q: Consider the data below. Suppose that in the aerobic exercise group we also measured the number of…
A: Let X is independent variable who represents the number of hour of per week and Y is dependent…
Q: Test the slope of the regression line for the following data. Use α = .01 x 140 121 102 90 68 30…
A: The independent variable is x. The dependent variable is y. The given data represents simple linear…
Q: Listed below are altitudes (thousands of feet) and outside air temperatures (°F) recorded during a…
A: we need to find R^2
Q: Listed below are altitudes (thousands of feet) and outside air temperatures (°F) recorded during…
A: These are the data that have been provided for the dependent and independent variable: Obs. XX =…
Q: Use the following information from a multiple regression analysis. n=15 b1=2 b2=6 Sb1=1.4 Sb2=0.5 a.…
A: Solution: Given information: n= 15 observation k= 2 independent variables b1= 2b2= 6Sb1= 1.4Sb2=…
Q: Given below are seven observations collected in a regression study on two variables, x (independent…
A: Regression
Q: The following table contains data from a sample of eight people regarding the number of bowls of…
A: Solution
Q: A researcher wants to know if there is a relationship between the number of shopping centers in a…
A: Hello! As you have posted more than 3 sub parts, we are answering the first 3 sub-parts. In case…
Q: A study was done to look at the relationship between number of movies people watch at the theater…
A: (1) Use EXCEL to obtain the coefficient of determination. EXCEL procedure: Go to EXCEL Go…
Q: Hello, could you please help me solve these problems? And please explain everything that I should…
A: As per the honor code, We’ll answer the first question since the exact one wasn’t specified. Please…
Q: Listed below are amounts of court income and salaries paid to the town justices for a certain town.…
A: Given: Sr. No. x y 1 68 27 2 403 49 3 1592 92 4 1120 58 5 288 40 6 252 61 7 120 28…
Q: Listed below are altitudes (thousands of feet) and outside air temperatures (°F) recorded during a…
A: Given data: Altitude 4 10 14 19 29 31 33 Temperature 55 31 27 -1 -27 -41 -54
Q: 10. Below is computer output from the least squares regression analysis on the body mass index, BMI,…
A: Given, BMI Coeff = 1.695 SE Coeff = 0.2280 t = 2.262 at 9 degree of freedom (n-1)1.695
Q: The following data were collected from a sample of students on the numbers of times they were tardy…
A: Given data: Number of Tardies, x Final exam grade, y 8 68 6 68 6 67 3 83 2 89 0 89…
Q: Listed below are altitudes (thousands of feet) and outside air temperatures (F) recorded during a…
A: Given data Listed below are altitudes (thousands of feet) and outside air temperatures (°F) recorded…
Q: Use the following information from a multiple regression analysis b, = 3 n= 20 b, = 2 So, = 1.1 S, =…
A:
Q: Given below are seven observations collected in a regression study on two variables, x (independent…
A: Regression is a numerical relationship between an explanatory variable and a response variable. In…
Q: The following data were collected from a sample of students on the numbers of times they were tardy…
A: Confidence interval for slope is given by, b1 ± tα/2,n-2*Sb1 where , b1 is estimate of slope Sb1 is…
Q: Listed below are amounts of court income and salaries paid to the town justices for a certain town.…
A: Given data, Court income Justice salary 68 31 415 47 1592 95 1150 52 268 40 252 55…
Q: Consider the following data set. a) plot the data (y versus x). Are there any points that appear…
A: The independent variable is x. The dependent variable is y. This is simple linear regression model.…
Q: Listed Below are amounts of bills for dinner and the amounts of tips thet were left. is there…
A: Note: Thank you for the question. Since multiple subparts are posted, according to our policy, we…
Q: If a p-value reported in the Excel linear regression output associated with a particular variable is…
A: Given that: A p-value associated with a particular variable is 0.007. The objective is to identify…
Q: The following are linear regression lines with prediction and confidence intervals. For each of the…
A: Given a sample of 48 apartment rental results in the regression graphs.
Q: an independent researcher wants to investigate if the factors which determine the house rent (Y,…
A: The critical value from student t distribution at 95% level of significance at n-2 degree of freedom…
Q: The following is a regression of credit scores based on an individual's age, income, their location…
A: For statement A Since the regression is run on individual and not on city therefore the regression…
Q: The following data relate to marks in Advanced Accounts and Business Statistics in B.Com. (H.), Il…
A:
Q: The following data are the monthly salaries and the grade point averages for students who obtained…
A: a. The data related to the monthly salaries (y) and the grade point averages (x) for students, who…
Q: The personnel director of a large hospital is interested in determining the relationship (if any)…
A: Solution
Q: The given scatterplot with a fitted regression line depicts total SAT scores and college grade point…
A: We know that, in scatter plot 1) If the data points lies in strip which shows ascending trend from…
Q: Use the following information from a multiple regression analysis. n=15 b1=4 b2=5 Sb1=1.3 Sb2=0.7 a.…
A: From the given information, n=15, b1=4 , b2=5sb1=1.3 , sb2=0.7 Thus,
Q: A manufacturing company that produces laminate for countertops is interested in studying the…
A: Given that
Q: Use the data given below to examine the association between Waist and %Body Fat. Complete parts a)…
A:
Q: Below is the output for regression equation for a realtor with 2 independent variables of square…
A:
Q: c). Find the equation of the sample regression line using Minitab. d). Interpret the meaning of…
A: c) Let x be the price and y be the sales. The regression equation is obtained by using MINITAB:…
Q: You are given the following data, where X1X1 (final percentage in math class) and X2X2 (number of…
A: Let the dependent variable Y is predicted using the regression model Y^=a+b1X1+b2X2, where Y…


Trending now
This is a popular solution!

Step by step
Solved in 3 steps with 1 images

- Find the equation of the regression line for the following data set. x 1 2 3 y 0 3 4Using the regression results in column (3):a. Do there appear to be important regional differences? Use an appropriate hypothesis test to explain your answer.b. Juanita is a 28-year-old female college graduate from the South. Mollyis a 28-year-old female college graduate from the West. Jennifer is a28-year-old female college graduate from the Midwest.i. Construct a 95% confidence interval for the difference in expectedearnings between Juanita and Molly.ii. Explain how you would construct a 95% confidence interval forthe difference in expected earnings between Juanita and Jennifer.(Hint: What would happen if you included West and excludedMidwest from the regression?)The accompanying table lists systolic blood pressures (mm Hg) and diastolic blood pressures (mm Hg) of adult females. Find the (a) explained variation, (b) unexplained variation, and (c) prediction interval for a systolic blood pressure of 118 mm Hg using a 99% confidence level. There is sufficient evidence to support a claim of a linear correlation, so it is reasonable to use the regression equation when making predictions. Systolic Diastolic 127 69 103 65 130 73 104 64 157 74 97 51 155 90 111 69 124 68 112 75 103 60 128 67
- A teacher conducted a regression analysis to investigate the relationship between student height and femur length. Computer output from the linear regression analysis is shown in the table. The analysis was performed on a sample of 24 students. Term CoefCoef SE CoefSE Coef Constant 28.34 0.945 Femur length 1.73 0.023 Assume that the conditions for inference for the slope of the regression equation have been met. Which of the following defines the margin of error for a 99.5 percent confidence interval for the slope of the least-squares regression equation? A)3.104 (0.023) B)3.104 (1.73) C)3.119 (0.023) D)3.119(0.945) E)3.119(1.73)The accompanying table lists systolic blood pressures (mm Hg) and diastolic blood pressures (mm Hg) of adult females. Find the prediction interval for a systolic blood pressure of 121mm Hg using a 99% confidence level. There is sufficient evidence to support a claim of a linear correlation, so it is reasonable to use the regression equation when making predictions. Systolic Diastolic 125 69 104 65 129 75 108 65 157 74 95 53 155 89 110 69 120 69 115 73 101 59 127 67 The 99% prediction interval for a systolic blood pressure of 121mm Hg is ____mm Hg<y<___mm Hg.Sarah is the office manager for a group of financial advisors who provide financial services for individual clients. She would like to investigate whether a relationship exists between the number of presentations made to prospective clients in a month and the number of new clients per month. The following table shows the number of presentations and corresponding new clients for a random sample of six employees. Employee Presentations New Clients 1 7 2 2 9 3 3 9 4 4 10 3 5 11 5 6 12 3 Sarah would like to use simple regression analysis to estimate the number of new clients per month based on the number of presentations made by the employee per month. The expected number of new clients per month for an employee who made 10 presentations per month is ________. 2.3982 1.6753 3.0521 3.4348
- Listed below are altitudes (thousands of feet) and outside air temperatures (°F) recorded during a flight. Find the (a) explained variation, (b) unexplained variation, and (c) indicated prediction interval. There is sufficient evidence to support a claim of a linear correlation, so it is reasonable to use the regression equation when making predictions. For the prediction interval, use a 95% confidence level with an altitude of 6327 ft (or 6.327 thousand feet). Altitude 2 8 13 23 28 31 32 Temperature 56 40 27 −1 −34 −41 −50 a. Find the explained variation. (Round to two decimal places as needed.) b. Find the unexplained variation. (Round to five decimal places as needed.) c. Find the indicated prediction interval. ______°F<y<______°FA random sample of 15 college soccer players were selected to investigate the relationship between heart rate and maximal oxygen uptake. The heart rate and maximal oxygen uptake were recorded for each player during a training session. A regression analysis of the data was conducted, where heart rate is the explanatory variable and maximal oxygen uptake is the response variable. If a 95 percent confidence interval is constructed for the slope of the population regression line, which of the following is a condition that must be checked? A)The true relationship between heart rate and maximal oxygen uptake is linear. B)The correlation between heart rate and maximal oxygen uptake is not equal to zero. C)The confidence interval is not biased. D).The point (x_,y_) falls on the regression line. The X and Y have a line on top. E)The slope is not equal to zero.A manager wishes to find out whether there is a relationship between the age of his employees and the number of sick days they take each year. The data for the sample follow. If the first letter of your last name starts with A to M, use level of significance 0.05, otherwise, if the first letter of your last name starts with N to Z, use level of significance 0.01. a. Draw/sketch a SCATTER PLOT with regression line and regression equation. b. State the null and alternative hypotheses. Ho (Null Hypothesis): Ha ( Alternative Hypothesis) c. Level of Significance d. Determine the degrees of freedom (df) and t critical value. e. Correlation coefficient (Pearson r). f. t statistic g. Compute the slope of regression line. h. Compute the mean of x and y i. Compute the intercept of regression line. j. Write the regression equation k. Write the complete interpretation of the results and conclusion.
- Based on the sample data and the regression line, complete the following. The managers of an electric utility wish to examine the relationship between temperature and electricity use in the utility's service region during the summer months. In particular, the managers wish to be able to predict total electricity use for a day from the maximum temperature that day. The bivariate data below give the maximum temperature (in degrees Fahrenheit) and the electricity use (in thousands of kilowatt hours) of electricity generated and sold for a random sample of summer days. A best-fitting line for the data, obtained from least-squares regression, is given by =y+83.852.67x, in which x denotes the maximum temperature and y denotes the electricity use. This line is shown in the scatter plot below. (a)For these data, values for electricity use that are greater than the mean of the values for electricity use tend to be paired with temperature values that are ▼(Choose one) the mean of…Bill is the office manager for a group of financial advisors who provide financial services for individual clients. She would like to investigate whether a relationship exists between the number of presentations made to prospective clients in a month and the number of new clients per month. The following table shows the number of presentations and corresponding new clients for a random sample of six employees. Employee Presentations New Clients 1 2 1 2 8 2 3 9 4 4 10 3 5 11 5 6 12 6 Bill would like to use simple regression analysis to estimate the number of new clients per month based on the number of presentations made by the employee per month. The average number of new clients per month for an employee who made 20 presentations per month is ________. 5.02 5.45 3.43 8.69In Exercises, presume that the assumptions for regression inferences are met.Study Time and Score. Following are the data on total hours studied over 2 weeks and test score at the end of the 2 weeks from Exercise. x 10 15 12 20 8 16 14 22 y 92 81 84 74 85 80 84 80 a. Determine a point estimate for the mean test score of all beginning calculus students who study for 15 hours.b. Find a 99% confidence interval for the mean test score of all beginning calculus students who study for 15 hours.c. Find the predicted test score of a beginning calculus student who studies for 15 hours.d. Determine a 99% prediction interval for the test score of a beginning calculus student who studies for 15 hours.ExerciseApplying the Concepts and SkillsIn Exercises, we repeat the information from Exercises. For each exercise here, discuss what satisfying Assumptions 1–3 for regression inferences by the variables under consideration would mean.
