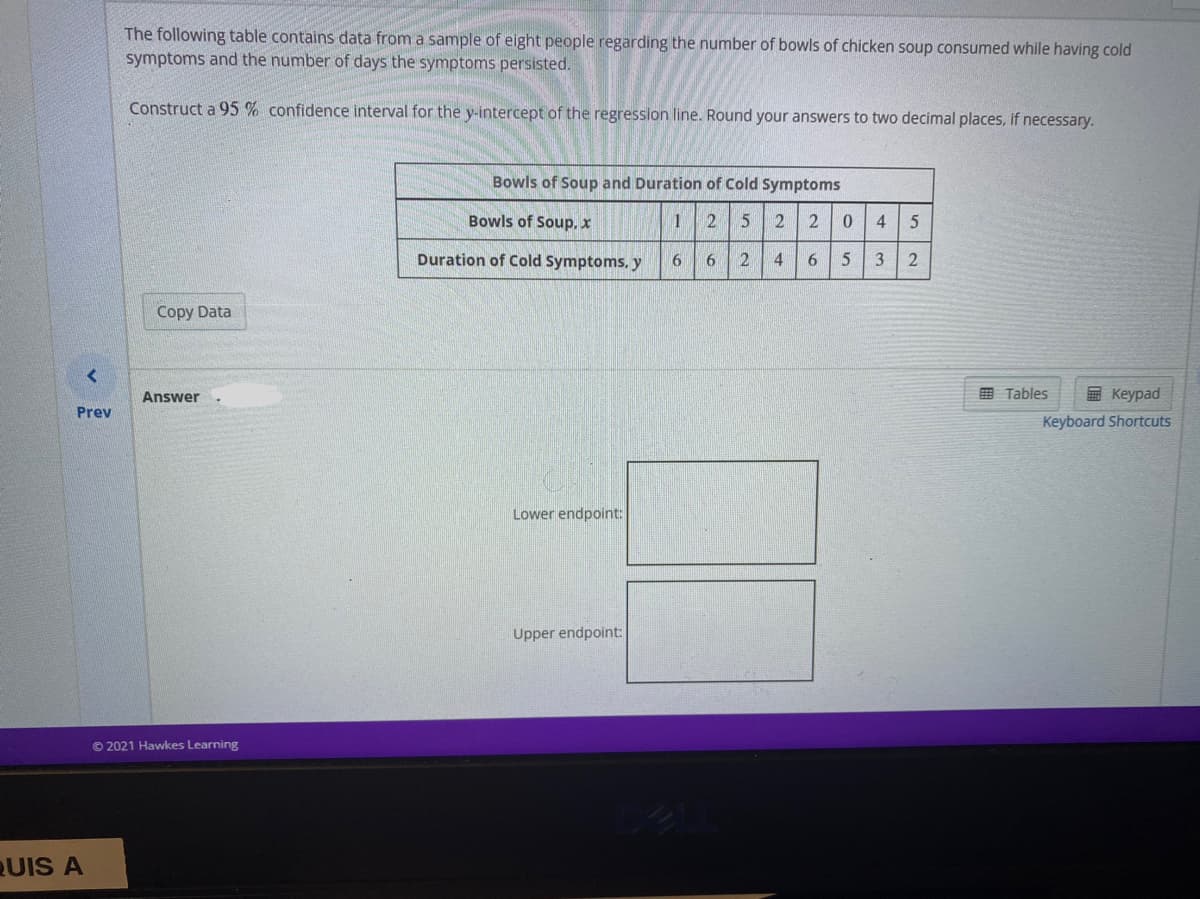
The following table contains data from a sample of eight people regarding the number of bowls of chicken soup consumed while having cold symptoms and the number of days the symptoms persisted. Construct a 95 % confidence interval for the y-intercept of the regression line. Round your answers to two decimal places, if necessary. Bowls of Soup and Duration of Cold Symptoms Bowls of Soup, x 2 4 Duration of Cold Symptoms, y 4 2 6. Copy Data Answer 田 Tables E Keypad Prev Keyboard Shortcuts


Q: A teacher conducted a regression analysis to investigate the relationship between student height and…
A: Given Information: (1-α)100% = 99.5% The degrees of freedom is df = n- 2 = 24-2 = 22…
Q: Below is the output for the regression analysis for percent of birth to teenage mothers (y) and ACT…
A: From the output, the slope is -1.65 and the intercept is 45.76.
Q: he following data shows the dexterity test scores of five assembly-line employees of Dimples Company…
A: Since you have asked multiple questions, we will solve the first question for you. If you want any…
Q: The table below lists weights (carats) and prices (dollars) of randomly selected diamonds. Find the…
A: Therefore, based on the sample data provided, it is found that the coefficient of determination is…
Q: Assume you have noted the following prices for books and the number of pages that each book…
A: 1 The regression output for the given dataset, as obtained in excel, is as follows:…
Q: WHat is the confidence interval? Consider the following data on x = rainfall volume (m3) and y =…
A:
Q: The following data on r = the line speed (feet per minute) and y = the number of defective parts…
A: Given data and required calculation is shown below
Q: Given below are seven observations collected in a regression study on two variables, x (independent…
A: Solution To find the correlation coefficient we will use Excel
Q: a) What kind of relationship exist between the exam scores and the clas sizes? Interpret the…
A: The regression line is given by score = 95 -1.2Size There is a negative relationship between the…
Q: Consider the set of ordered pairs shown below. Assuming that the regression equation is y = 1.334…
A:
Q: A sample of n = 120 scores were presented using the Tenacity (authority) scores to the following…
A: Given info: The p value for the multiple regression analysis for 1. tenacity and voice is 0.001.…
Q: The following table contains data from a sample of ten students regarding the numbers of parking…
A: Solution We find confidence interval by using excal
Q: You are given the same test scores (x) and weekly sales (y) data as in problem 7a. Weekly Sales…
A:
Q: A study was done to look at the relationship between number of vacation days employees take each…
A: Excel Procedure: Enter Vacation days and Sick days in Excel>Data>Data Analysis>…
Q: A physics tuition teacher claims that the usual practice of going through exercises during the class…
A: The mean difference is tested between the two independent samples are calculated using the t test…
Q: Given below are seven observations collected in a regression study on two variables, x (independent…
A: Regression
Q: Given below are seven observations collected in a regression study on two variables, x (independent…
A: x y 2 12 3 9 6 8 7 7 8 6 7 5 9 2
Q: The following table contains data from a sample of ten students regarding the numbers of parking…
A: Output: From the output,
Q: What is the relationship between the attendance at a major league ball game and the total number of…
A: Since you have posted a question with multiple sub-parts, we will solve the first three sub-parts…
Q: Hello, could you please help me solve these problems? And please explain everything that I should…
A: As per the honor code, We’ll answer the first question since the exact one wasn’t specified. Please…
Q: Listed below are amounts of court income and salaries paid to the town justices for a certain town.…
A: Given: Sr. No. x y 1 68 27 2 403 49 3 1592 92 4 1120 58 5 288 40 6 252 61 7 120 28…
Q: The following data on x = the line speed (feet per minute) and y = the number of defective parts…
A: Obtain the 95% confidence interval for the mean number of defective parts for a line speed of 25…
Q: A statistical program is recommended. Consider the following data for a dependent variable y and two…
A:
Q: You are given the following data, where X1X1 (final percentage in math class) and X2X2 (number of…
A: Data given as, X1 (final percentage in math class) and X2 (number of absences) are used to predict…
Q: The following table contains data from a sample of eight people regarding the number of bowls of…
A: Solution Yo find the 95% confidence interval for the y intercept we will use Excel LOWER ENDPOINT =…
Q: 36. In exercise 7, the data on y = annual sales ($1000s) for new customer accounts and a = number of…
A:
Q: The data on y = annual sales ($1,000s) for new customer accounts and x = number of years of…
A: ŷ = 80 + 4x. For these data, x¯ = 7, Σ(xi − x)2 = 142, and s = 4.6098
Q: The following data relate to marks in Advanced Accounts and Business Statistics in B.Com. (H.), II…
A:
Q: 10. Below is computer output from the least squares regression analysis on the body mass index, BMI,…
A: Given, BMI Coeff = 1.695 SE Coeff = 0.2280 t = 2.262 at 9 degree of freedom (n-1)1.695
Q: The following data shows the academic performance of 14 students and their motivation level. The…
A: ----------------------------------------------------------------------------------------…
Q: A statistical program is recommended. Consider the following data for a dependent variable y and two…
A: Given: x1 x2 y 30 12 94 47 10 108 25 17 112 51 16 178 40 5 94 51 19 175 74 7…
Q: The following data were collected from a sample of students on the numbers of times they were tardy…
A: Given data: Number of Tardies, x Final exam grade, y 8 68 6 68 6 67 3 83 2 89 0 89…
Q: Use the following information from a multiple regression analysis b, = 3 n= 20 b, = 2 So, = 1.1 S, =…
A:
Q: Construct a 95 % confidence interval for the slope of the regression line. Round your answers to two…
A: Solution Confidence interval by using excal
Q: ou are given the following data, where X1X1 (final percentage in history class) and X2X2 (number of…
A: Hello! As you have posted more than 3 sub parts, we are answering the first 3 sub-parts. In case…
Q: Years Sales 1 80 3 97 4 92 4 102 6 103 8 111 10 119 10 123 11 117 13 136
A: Regression is an inferential statistical procedure.
Q: The following data were collected from a sample of students on the numbers of times they were tardy…
A: Confidence interval for slope is given by, b1 ± tα/2,n-2*Sb1 where , b1 is estimate of slope Sb1 is…
Q: The following are linear regression lines with prediction and confidence intervals. For each of the…
A: Given a sample of 48 apartment rental results in the regression graphs.
Q: In exercise 7, the data on y = annual sales ($1000s) for new customer accounts and x = number of…
A:
Q: an independent researcher wants to investigate if the factors which determine the house rent (Y,…
A: The critical value from student t distribution at 95% level of significance at n-2 degree of freedom…
Q: The following data relate to marks in Advanced Accounts and Business Statistics in B.Com. (H.), Il…
A:
Q: A physics tuition teacher claims that the usual practice of going through exercises during the class…
A: Given the tables provides the average scores of students in their recent physics quarterly tests…
Q: Use the following information from a multiple regression analysis. n=15 b1=4 b2=5 Sb1=1.3 Sb2=0.7 a.…
A: From the given information, n=15, b1=4 , b2=5sb1=1.3 , sb2=0.7 Thus,
Q: The data on y = annual sales ($1,000s) for new customer accounts and x = number of years of…
A: For the given data Find ( a ) 95% confidence interval = ? ( b ) 95% prediction interval = ?
Q: a) construct a 95% confidence interval for the regression coefficient for x1 and interpret its…
A: a. The regression analysis is conducted using EXCEL. The software procedure is given below: Enter…
Q: rite out the regression equation using the information from the table: Variable Est.…
A:
Q: Use the data given below to examine the association between Waist and %Body Fat. Complete parts a)…
A:
Q: The following table lists the monthly incomes (in hundreds of dollars) and the monthly rents paid…
A: Note: Hey, since there are multiple subparts posted, we will answer first three subparts. If you…
Q: The article "Approach to Confidence Interval Estimation for Curve Numbers" (R. McCuen, Journal of…
A:


Trending now
This is a popular solution!

Step by step
Solved in 2 steps with 2 images

- The following data are the monthly salaries and the grade point averages for students who obtained a bachelor's degree in business administration. GPA Monthly Salary ($) 2.6 3,600 3.4 3,900 3.6 4,300 3.2 3,800 3.5 4,200 2.9 3,900 The estimated regression equation for these data is and . Use Table 1 of Appendix B. a. Develop a point estimate of the starting salary for a student with a GPA of (to 1 decimal). b. Develop a confidence interval for the mean starting salary for all students with a GPA (to 2 decimals). ( , ) c. Develop a prediction interval for Ryan Dailey, a student with a GPA of (to 2 decimals). ( , ) d. Discuss the differences in your answers to parts (b) and (c).The following table contains data from a sample of ten students regarding the numbers of parking tickets they received during one semester and their monthly incomes (including allowances from parents as well as paychecks from employment as income). Construct a 95%95% confidence interval for the y-intercept of the regression line. Round your answers to two decimal places, if necessary. Parking Tickets and Monthly Income Number of Tickets, x Monthly Income (in Dollars), y 7 2800 3 2300 8 3400 10 3800 10 3800 2 1600 6 2100 5 1800 5 2500 5 2000In exercise 12, the following data on x = average daily hotel room rate and y = amount spent on entertainment (The Wall Street Journal, August 18, 2011) lead to the estimated regression equation ŷ = 17.49 + 1.0334x. For these data SSE = 1541.4.Click on the datafile logo to reference the data. Use Table 1 of Appendix B. a. Predict the amount spent on entertainment for a particular city that has a daily room rate of $89 (to 2 decimals).$ b. Develop a 95% confidence interval for the mean amount spent on entertainment for all cities that have a daily room rate of $89 (to 2 decimals).$ to $ c. The average room rate in Chicago is $128. Develop a 95% prediction interval for the amount spent on entertainment in Chicago (to 2 decimals).
- A researcher developed a regression model to predict the cost of a meal based on the summated rating (sum of ratings for food, decor,and service) and the cost per meal for 12 restaurants. The results of the study show that b1=1.4379 and Sb1=0.1397. a. At the 0.05 level of significance, is there evidence of a linear relationship between the summated rating of a restaurant and the cost of a meal? b. Construct a 95% confidence interval estimate of the population slope, β1. a. Determine the hypotheses for the test. Choose the correct answer below. A. H0: β1=0 H1: β1≠0 B. H0: β0≤0 H1: β0>0 C. H0: β1≤0 H1: β1>0 D. H0: β0≥0 H1: β0<0 E. H0: β1≥0 H1: β1<0 F. H0: β0=0 H1: β0≠0 Compute the test statistic. The test statistic is ? (Round to two decimal places as needed.) Determine the critical value(s). The critical value(s) is(are) ? (Use a comma to separate answers as needed.…In exercise 12, the following data on x = average daily hotel room rate and y = amount spent on entertainment (The Wall Street Journal, August 18, 2011) lead to the estimated regression equation ŷ = 17.49 + 1.0334x. For these data SSE = 1541.4. Use Table 1 of Appendix B.Click on the datafile logo to reference the data. a. Predict the amount spent on entertainment for a particular city that has a daily room rate of $89 (to 2 decimals).$ b. Develop a 95% confidence interval for the mean amount spent on entertainment for all cities that have a daily room rate of $89 (to 2 decimals).$ to $ c. The average room rate in Chicago is $128. Develop a 95% prediction interval for the amount spent on entertainment in Chicago (to 2 decimals).$ to $A sample of n = 120 scores were presented using the Tenacity (authority) scores to the following predictors: age gender, SES, tone of voice, and clothing. Using a two-tailed test at the 0.05 level of significance, a multiple regression analysis was computed: 1. tenacity and age (pvalue = 0.043); 2. tenacity and gender (pvalue = 0.102); 3. tenacity and SES (pvalue = 0.40); Using the pvalue, provide your DECISION, whether: Accept Ho or Reject Ho, Accept Ha
- Use the following information from a multiple regression analysis. n=15 b1=2 b2=6 Sb1=1.4 Sb2=0.5 a. Which variable has the largest slope, in units of a t statistic? b. Construct a 90% confidence interval estimate of the population slope, β1. c. At the 0.10 level of significance, determine whether each independent variable makes a significant contribution to the regression model. On the basis of these results, indicate the independent variables to include in this model.A sample of n = 120 scores were presented using the Tenacity (authority) scores to the following predictors: age gender, SES, tone of voice, and clothing. Using a two-tailed test at the 0.05 level of significance, a multiple regression analysis was computed: 1. tenacity and voice (pvalue = 0.001); 2. tenacity and clothing (pvalue = 0.017); Using the pvalue, provide your DECISION, whether: Accept Ho or Reject Ho, Accept HaA sample of n = 120 scores were presented using the Tenacity (authority) scores to the following predictors: age gender, SES, tone of voice, and clothing. Using a two-tailed test at the 0.05 level of significance, a multiple regression analysis was computed: 1. tenacity and age (pvalue = 0.043) Using the pvalue, provide your DECISION, whether: Accept Ho or Reject Ho, Accept Ha
- Use the following information from a multiple regression analysis to complete below n=35 b1=25 b2=25 Sb1=10 Sb2=8 Construct a 95% confidence interval estimate of the population slope, β1.______≤β1≤________ (Round to four decimal places as needed.)A sample of n = 120 scores were presented using the Tenacity (authority) scores to the following predictors: age gender, SES, tone of voice, and clothing. Using a two-tailed test at the 0.05 level of significance, a multiple regression analysis was computed: 4. tenacity and voice (pvalue = 0.001); Using the pvalue, provide your DECISION, whether: Accept Ho or Reject Ho, Accept HaGiven below are seven observations collected in a regression study on two variables, x (independent variable) and y (dependent variable). Copy and paste the numbers in an Excel worksheet and then use Excel's Regression tool to conduct a simple linear regression analysis. Choose 95% confidence level. Answer the following questions: x y 2 12 3 9 6 8 7 7 8 6 7 5 9 2 t statistics is statistically significant at 5% level. Answer Yes or No. Yes No What is the lower bound of the 95% confidence interval for the independent variable x (Keep 2 decimal places) What is the upper bound of the 95% confidence interval for the independent variable x (Keep 2 decimal places)