
MATLAB: An Introduction with Applications
6th Edition
ISBN: 9781119256830
Author: Amos Gilat
Publisher: John Wiley & Sons Inc
expand_more
expand_more
format_list_bulleted
Related questions
Question
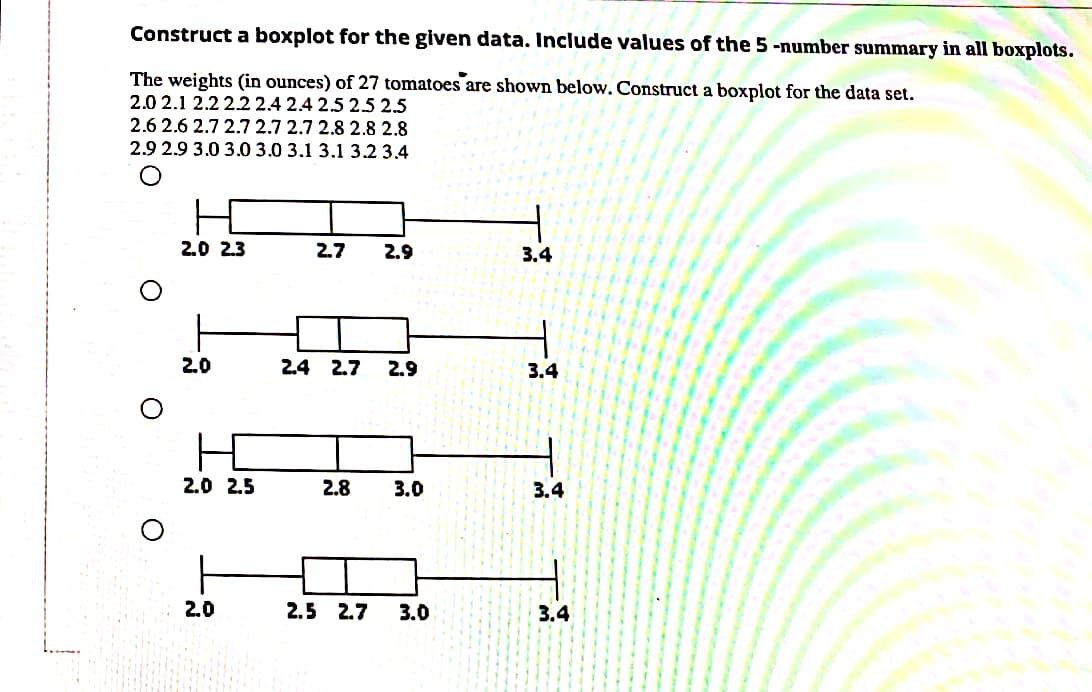

Transcribed Image Text:Construct a boxplot for the given data. Include values of the 5 -number summary in all boxplots.
The weights (in ounces) of 27 tomatoes are shown below. Construct a boxplot for the data set.
2.0 2.1 2.2 22 2.4 2.4 2.5 2.5 2.5
2.6 2.6 2.7 2.7 2.7 2.7 2.8 2.8 2.8
2.9 2.9 3.0 3.0 3.0 3.1 3.1 3.2 3.4
2.0 2.3
2.7
2.9
3.4
2.0
2.4 2.7
2.9
3.4
2.0 2.5
2.8
3.0
3.4
2.0
2.5 2.7
3.0
3.4
Expert Solution
This question has been solved!
Explore an expertly crafted, step-by-step solution for a thorough understanding of key concepts.

This is a popular solution

Trending nowThis is a popular solution!

Step by stepSolved in 4 steps with 1 images

Knowledge Booster

Similar questions
- Calculate the five-number summary of the given data. Use the approximation method. 25,16,12,17,25,16,14,8,23,22,7,3,17,5,15arrow_forwardUse the same scales to construct boxplots for the pulse rates of males and females from the accompanying data sets. Use the boxplots to compare the two data sets. Click the icon to view the data sets. Men's Pulse Rates 62 60 70 70 62 86 82 77 76 74 Full data set 87 53 90 65 69 56 80 61 76 80 53 60 67 63 62 49 70 60 70 56 64 77 67 60 69 73 73 62 50 57 Women's Pulse Rates 78 68 70 70 77 76 98 70 66 78 70 58 74 77 78 92 95 60 100 100 77 64 84 63 72 77 75 90 88 73 83 71 76 103 62 70 70 89 74 80 Choose the graphs that represent (picture attached!!) Compare the two boxplots. Choose the correct answer below. A. In general, it appears that males have higher pulse rates than females. The variation among the male pulse rates is much greater…arrow_forwardThe heights, in inches, of the four members of a barbershop quartet of singers are listed below. 72,68,67,73 Find the population variance for this data set. Round to one decimal place if necessary.arrow_forward
- Refer to the dotplot below. adm. 30 10 20 40 50 60 70 a. How many values are displayed? b. What data value is an outlier? c. How many data values are less than 30? 80 90 100arrow_forwardThe data to the right represent the number of chocolate chips per cookie in a random sample of a name brand and a store brand. Complete parts (a) to (c) below.. 10 N (a) Draw side-by-side boxplots for each brand of cookie. Label the boxplots "N" for the name brand and "S" for the store brand. Choose the correct answer below. OA. OB. O C. C N I 10 on he Full data set Name Brand Store Brand 26 23 32 28 33 15 29 22 31 21 17 27 23 35 25 28 19 26 23 22 28 24 24 24 22 28 +arrow_forwardearrow_forward
- mg The total blood cholesterol level was measured for each of 20 adults. Here are the 20 measurements (in ). dL 129, 138, 154, 158, 170, 172, 176, 176, 184, 187, 189, 190, 199, 199, 201, 206, 213, 220, 227, 249 Send data to Excel Send data to calculator Frequency 8 6+ 4- 24 0 125 2 150 Answer the questions below. 4 175 200 Cholesterol level (in mg/dl) 8 (a) For these data, which measures of central tendency take more than one value? Choose all that apply. Check (b) Suppose that the measurement 249 (the largest measurement in the data set) were replaced by 348. Which measures of central tendency would be affected by the change? Choose all that apply. (c) Suppose that, starting with the original data set, the largest measurement were removed. Which measures of central tendency would be changed from those of the original data set? Choose all that apply. A 225 2 250 Mean Median Mode ONone of these measures Mean Median Mode ONone of these measures Mean Median Mode None of these measures X…arrow_forwardFind the 5 number summary for the data shown below. 31 3 27 34 53 86 15 94 82 5 number summary: Submit Questionarrow_forwardFind the mode of the following list of weights (in pounds) of Boston terriers at a pet store. 17,12,8,21,8,16,12,8,21,16,8arrow_forward
arrow_back_ios
SEE MORE QUESTIONS
arrow_forward_ios
Recommended textbooks for you
- MATLAB: An Introduction with ApplicationsStatisticsISBN:9781119256830Author:Amos GilatPublisher:John Wiley & Sons Inc
 Probability and Statistics for Engineering and th...StatisticsISBN:9781305251809Author:Jay L. DevorePublisher:Cengage Learning
 Statistics for The Behavioral Sciences (MindTap C...StatisticsISBN:9781305504912Author:Frederick J Gravetter, Larry B. WallnauPublisher:Cengage Learning
  Elementary Statistics: Picturing the World (7th E...StatisticsISBN:9780134683416Author:Ron Larson, Betsy FarberPublisher:PEARSON
 The Basic Practice of StatisticsStatisticsISBN:9781319042578Author:David S. Moore, William I. Notz, Michael A. FlignerPublisher:W. H. Freeman
 Introduction to the Practice of StatisticsStatisticsISBN:9781319013387Author:David S. Moore, George P. McCabe, Bruce A. CraigPublisher:W. H. Freeman
MATLAB: An Introduction with Applications
Statistics
ISBN:9781119256830
Author:Amos Gilat
Publisher:John Wiley & Sons Inc
Probability and Statistics for Engineering and th...
Statistics
ISBN:9781305251809
Author:Jay L. Devore
Publisher:Cengage Learning
Statistics for The Behavioral Sciences (MindTap C...
Statistics
ISBN:9781305504912
Author:Frederick J Gravetter, Larry B. Wallnau
Publisher:Cengage Learning
Elementary Statistics: Picturing the World (7th E...
Statistics
ISBN:9780134683416
Author:Ron Larson, Betsy Farber
Publisher:PEARSON
The Basic Practice of Statistics
Statistics
ISBN:9781319042578
Author:David S. Moore, William I. Notz, Michael A. Fligner
Publisher:W. H. Freeman
Introduction to the Practice of Statistics
Statistics
ISBN:9781319013387
Author:David S. Moore, George P. McCabe, Bruce A. Craig
Publisher:W. H. Freeman