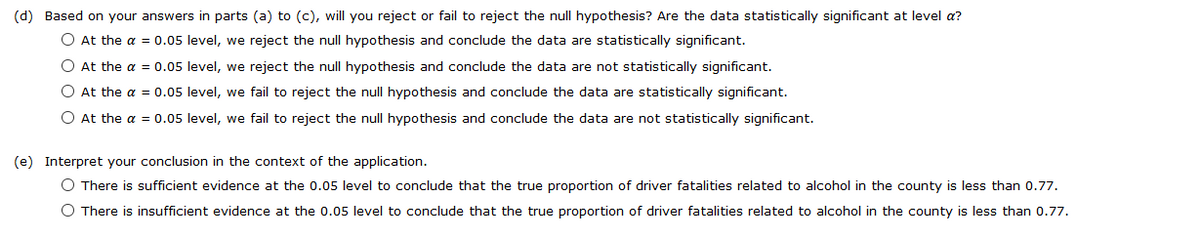
(d) Based on your answers in parts (a) to (c), will you reject or fail to reject the null hypothesis? Are the data statistically significant at level a? O At the a = 0.05 level, we reject the null hypothesis and conclude the data are statistically significant. O At the a = 0.05 level, we reject the null hypothesis and conclude the data are not statistically significant. O At the a = 0.05 level, we fail to reject the null hypothesis and conclude the data are statistically significant. O At the a = 0.05 level, we fail to reject the null hypothesis and conclude the data are not statistically significant. (e) Interpret your conclusion in the context of the application. O There is sufficient evidence at the 0.05 level to conclude that the true proportion of driver fatalities related to alcohol in the county is less than 0.77. O There is insufficient evidence at the 0.05 level to conclude that the true proportion of driver fatalities related to alcohol in the county is less than 0.77.
(d) Based on your answers in parts (a) to (c), will you reject or fail to reject the null hypothesis? Are the data statistically significant at level a? O At the a = 0.05 level, we reject the null hypothesis and conclude the data are statistically significant. O At the a = 0.05 level, we reject the null hypothesis and conclude the data are not statistically significant. O At the a = 0.05 level, we fail to reject the null hypothesis and conclude the data are statistically significant. O At the a = 0.05 level, we fail to reject the null hypothesis and conclude the data are not statistically significant. (e) Interpret your conclusion in the context of the application. O There is sufficient evidence at the 0.05 level to conclude that the true proportion of driver fatalities related to alcohol in the county is less than 0.77. O There is insufficient evidence at the 0.05 level to conclude that the true proportion of driver fatalities related to alcohol in the county is less than 0.77.

Glencoe Algebra 1, Student Edition, 9780079039897, 0079039898, 2018
18th Edition
ISBN:9780079039897
Author:Carter
Publisher:Carter
Chapter10: Statistics
Section10.6: Summarizing Categorical Data
Problem 30PPS

Related questions

Question
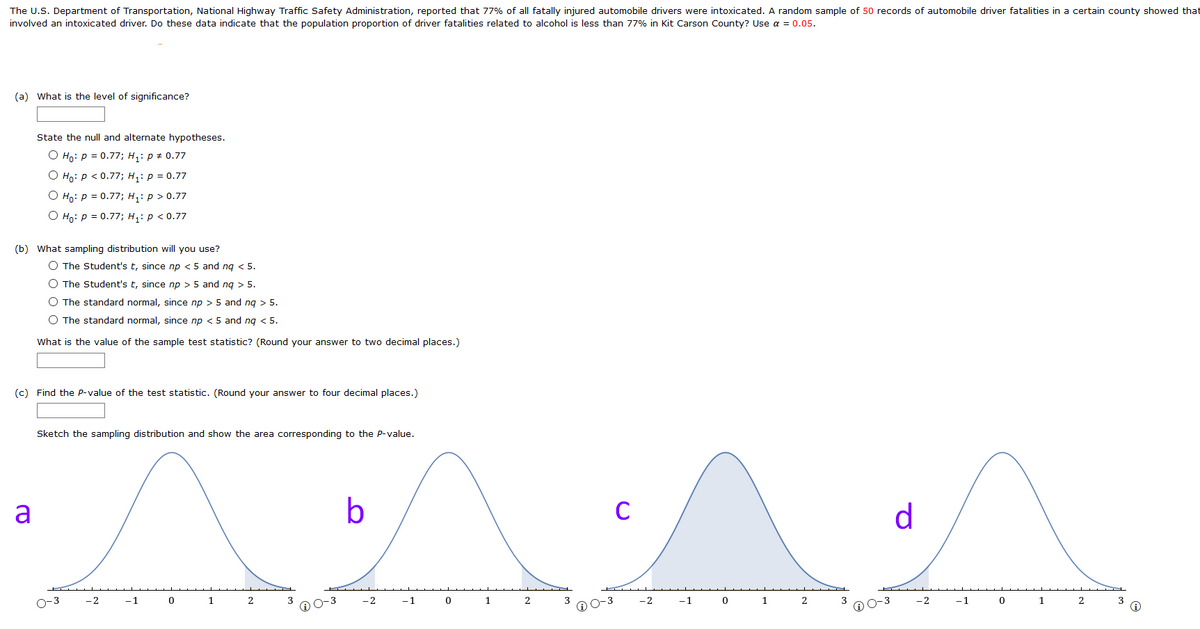
The U.S. Department of Transportation, National Highway Traffic Safety Administration, reported that 77% of all fatally injured automobile drivers were intoxicated. A random sample of 50 records of automobile driver fatalities in a certain county showed that 33 involved an intoxicated driver. Do these data indicate that the population proportion of driver fatalities related to alcohol is less than 77% in Kit Carson County? Use ? = 0.05.
I need help with sketching (d) and (e)
Transcribed Image Text:The U.S. Department of Transportation, National Highway Traffic Safety Administration, reported that 77% of all fatally injured automobile drivers were intoxicated. A random sample of 50 records of automobile driver fatalities in a certain county showed that
involved an intoxicated driver. Do these data indicate that the population proportion of driver fatalities related to alcohol is less than 77% in Kit Carson County? Use a = 0.05.
(a) What is the level of significance?
State the null and alternate hypotheses.
О на: р 3D 0.77; н,: р+0.77
О но: р <0.77; Hi: р %3D0.77
О но: р 3D 0.77; Hі: р> 0.77
O Ho: p = 0.77; H: p < 0.77
(b) What sampling distribution will you use?
O The Student's t, since np < 5 and ng < 5.
O The Student's t, since np > 5 and ng > 5.
O The standard normal, since np > 5 and ng > 5.
O The standard normal, since np < 5 and ng < 5.
What is the value of the sample test statistic? (Round your answer to two decimal places.)
(c) Find the P-value of the test statistic. (Round your answer to four decimal places.)
Sketch the sampling distribution and show the area corresponding to the P-value.
a
b
C
d
O-3
-2
-1
1
O O-
-2
-1
1
-3
-2
-1
1
2
-2
-1
1
3
Transcribed Image Text:(d) Based on your answers in parts (a) to (c), will you reject or fail to reject the null hypothesis? Are the data statistically significant at level a?
O At the a = 0.05 level, we reject the null hypothesis and conclude the data are statistically significant.
O At the a = 0.05 level, we reject the null hypothesis and conclude the data are not statistically significant.
O At the a = 0.05 level, we fail to reject the null hypothesis and conclude the data are statistically significant.
O At the a = 0.05 level, we fail to reject the null hypothesis and conclude the data are not statistically significant.
(e) Interpret your conclusion in the context of the application.
O There is sufficient evidence at the 0.05 level to conclude that the true proportion of driver fatalities related to alcohol in the county is less than 0.77.
O There is insufficient evidence at the 0.05 level to conclude that the true proportion of driver fatalities related to alcohol in the county is less than 0.77.
Expert Solution
This question has been solved!
Explore an expertly crafted, step-by-step solution for a thorough understanding of key concepts.

Step by step
Solved in 2 steps

Knowledge Booster


Learn more about
Need a deep-dive on the concept behind this application? Look no further. Learn more about this topic, statistics and related others by exploring similar questions and additional content below.Recommended textbooks for you
Glencoe Algebra 1, Student Edition, 9780079039897…
Algebra
ISBN:
9780079039897
Author:
Carter
Publisher:
McGraw Hill
Glencoe Algebra 1, Student Edition, 9780079039897…
Algebra
ISBN:
9780079039897
Author:
Carter
Publisher:
McGraw Hill