(iv) Based on your answers in parts (i)-(ii), will you reject or fail to reject the null hypothesis? Are the data statistically significant at level a? O At the a = 0.05 level, we reject the null hypothesis and conclude the data are not statistically significant. O At the a = 0.05 level, we reject the null hypothesis and conclude the data are statistically significant. O At the a = 0.05 level, we fail to reject the null hypothesis and conclude the data are not statistically significant. O At the a = 0.05 level, we fail to reject the null hypothesis and conclude the data are statistically significant. (v) Interpret your conclusion in the context of the application. O Fail to reject the null hypothesis, there is sufficient evidence that there is a difference in mean vocabulary scores between the control and experimental groups. O Reject the null hypothesis, there is sufficient evidence that there is a difference in mean vocabulary scores between the control and experimental groups. Reject the null hypothesis, there is insufficient evidence that there is a difference in mean vocabulary scores between the control and experimental groups. O Fail to reject the null hypothesis, there is insufficient evidence that there is a difference in mean vocabulary scores between the control and experimental groups. (b) Find a 95% confidence interval for 4, - 42. (Round your answers to two decimal places.) lower limit upper limit Explain the meaning of the confidence interval in the context of the problem. O Because the interval contains only positive numbers, this indicates that at the 95% confidence level, the population mean score for the experimental group is higher than for the control group. O Because the interval contains both positive and negative numbers, this indicates that at the 95% confidence level, we cannot say that the population mean scores are different before any instruction began. O Because the interval contains both positive and negative numbers, this indicates that at the 95% confidence level, the population mean score for the experimental group is higher than for the control group. O Because the interval contains only negative numbers, this indicates that at the 95% confidence level, the population mean score for the experimental group is lower than for the control group.
(iv) Based on your answers in parts (i)-(ii), will you reject or fail to reject the null hypothesis? Are the data statistically significant at level a? O At the a = 0.05 level, we reject the null hypothesis and conclude the data are not statistically significant. O At the a = 0.05 level, we reject the null hypothesis and conclude the data are statistically significant. O At the a = 0.05 level, we fail to reject the null hypothesis and conclude the data are not statistically significant. O At the a = 0.05 level, we fail to reject the null hypothesis and conclude the data are statistically significant. (v) Interpret your conclusion in the context of the application. O Fail to reject the null hypothesis, there is sufficient evidence that there is a difference in mean vocabulary scores between the control and experimental groups. O Reject the null hypothesis, there is sufficient evidence that there is a difference in mean vocabulary scores between the control and experimental groups. Reject the null hypothesis, there is insufficient evidence that there is a difference in mean vocabulary scores between the control and experimental groups. O Fail to reject the null hypothesis, there is insufficient evidence that there is a difference in mean vocabulary scores between the control and experimental groups. (b) Find a 95% confidence interval for 4, - 42. (Round your answers to two decimal places.) lower limit upper limit Explain the meaning of the confidence interval in the context of the problem. O Because the interval contains only positive numbers, this indicates that at the 95% confidence level, the population mean score for the experimental group is higher than for the control group. O Because the interval contains both positive and negative numbers, this indicates that at the 95% confidence level, we cannot say that the population mean scores are different before any instruction began. O Because the interval contains both positive and negative numbers, this indicates that at the 95% confidence level, the population mean score for the experimental group is higher than for the control group. O Because the interval contains only negative numbers, this indicates that at the 95% confidence level, the population mean score for the experimental group is lower than for the control group.

Holt Mcdougal Larson Pre-algebra: Student Edition 2012
1st Edition
ISBN:9780547587776
Author:HOLT MCDOUGAL
Publisher:HOLT MCDOUGAL
Chapter11: Data Analysis And Probability
Section: Chapter Questions
Problem 8CR

Related questions
Topic Video
Question
Questions A and B. Please!
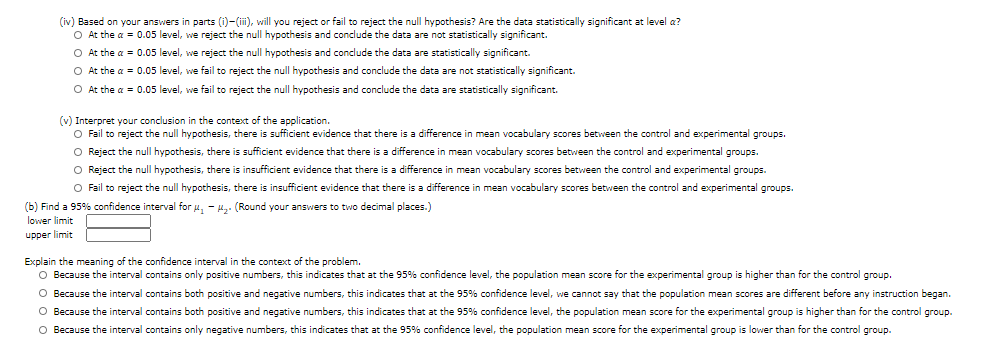
Transcribed Image Text:(iv) Based on your answers in parts (i)-(ii), will you reject or fail to reject the null hypothesis? Are the data statistically significant at level a?
O At the a = 0.05 level, we reject the null hypothesis and conclude the data are not statistically significant.
O At the a = 0.05 level, we reject the null hypothesis and conclude the data are statistically significant.
O At the a = 0.05 level, we fail to reject the null hypothesis and conclude the data are not statistically significant.
O At the a = 0.05 level, we fail to reject the null hypothesis and conclude the data are statistically significant.
(v) Interpret your conclusion in the context of the application.
O Fail to reject the null hypothesis, there is sufficient evidence that there is a difference in mean vocabulary scores between the control and experimental groups.
O Reject the null hypothesis, there is sufficient evidence that there is a difference in mean vocabulary scores between the control and experimental groups.
O Reject the null hypothesis, there is insufficient evidence that there is a difference in mean vocabulary scores between the control and experimental groups.
O Fail to reject the null hypothesis, there is insufficient evidence that there is a difference in mean vocabulary scores between the control and experimental groups.
(b) Find a 95% confidence interval for u, - H,. (Round your answers to two decimal places.)
lower limit
upper limit
Explain the meaning of the confidence interval in the context of the problem.
O Because the interval contains only positive numbers, this indicates that at the 95% confidence level, the population mean score for the experimental group is higher than for the control group.
O Because the interval contains both positive and negative numbers, this indicates that at the 95% confidence level, we cannot say that the population mean scores are different before any instruction began.
O Because the interval contains both positive and negative numbers, this indicates that at the 95% confidence level, the population mean score for the experimental group is higher than for the control group.
O Because the interval contains only negative numbers, this indicates that at the 95% confidence level, the population mean score for the experimental group is lower than for the control group.
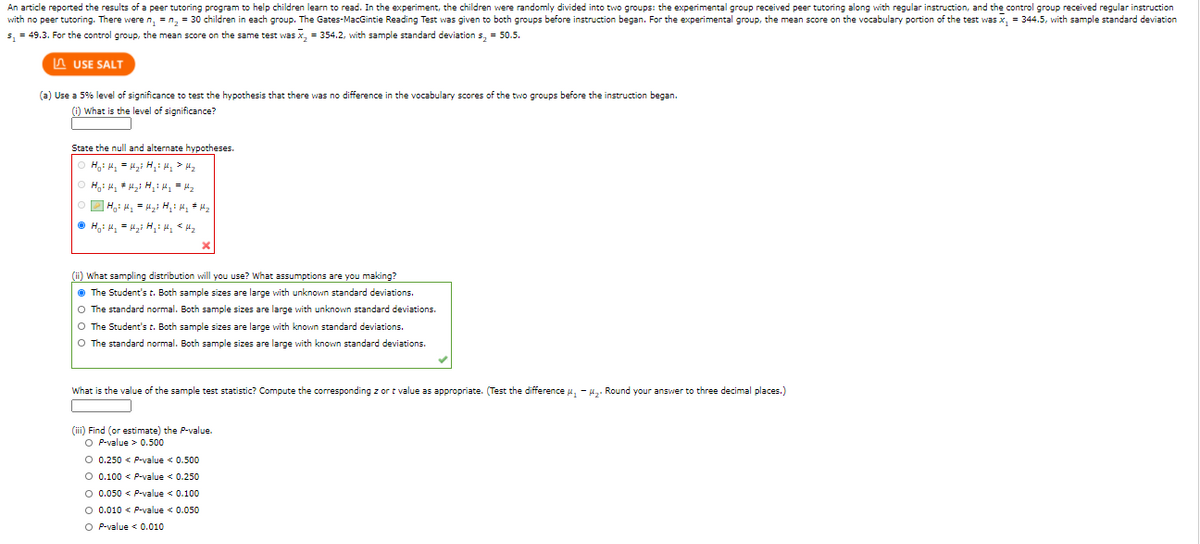
Transcribed Image Text:An article reported the results of a peer tutoring program to help children learn to read. In the experiment, the children were randomly divided into two groups: the experimental group received peer tutoring along with regular instruction, and the control group received regular instruction
with no peer tutoring. There were n, = n, = 30 children in each group. The Gates-MacGintie Reading Test was given to both groups before instruction began. For the experimental group, the mean score on the vocabulary portion of the test was x, = 344.5, with sample standard deviation
5, = 49.3. For the control group, the mean score on the same test was x, = 354.2, with sample standard deviation s, = 50.5.
A USE SALT
(a) Use a 5% level of significance to test the hypothesis that there was no difference in the vocabulary scores of the two groups before the instruction began.
(1) what is the level of significance?
State the null and alternate hypotheses.
(ii) What sampling distribution will you use? What assumptions are you making?
O The Student's t. Both sample sizes are large with unknown standard deviations.
O The standard normal. Both sample sizes are large with unknown standard deviations.
O The Student's t. Both sample sizes are large with known standard deviations.
O The standard normal. Both sample sizes are large with known standard deviations.
What is the value of the sample test statistic? Compute the corresponding z or t value as appropriate. (Test the difference u, - H,. Round your answer to three decimal places.)
(iii) Find (or estimate) the P-value.
O P-value > 0.500
O 0.250 < P-value < 0.500
O 0.100 < P-value < 0.250
O 0.050 < P-value < 0.100
O 0.010 < P-value < 0.050
O P-value < 0.010
Expert Solution
This question has been solved!
Explore an expertly crafted, step-by-step solution for a thorough understanding of key concepts.

Step by step
Solved in 3 steps with 1 images

Knowledge Booster


Learn more about
Need a deep-dive on the concept behind this application? Look no further. Learn more about this topic, statistics and related others by exploring similar questions and additional content below.Recommended textbooks for you
Holt Mcdougal Larson Pre-algebra: Student Edition…
Algebra
ISBN:
9780547587776
Author:
HOLT MCDOUGAL
Publisher:
HOLT MCDOUGAL

College Algebra (MindTap Course List)
Algebra
ISBN:
9781305652231
Author:
R. David Gustafson, Jeff Hughes
Publisher:
Cengage Learning

Glencoe Algebra 1, Student Edition, 9780079039897…
Algebra
ISBN:
9780079039897
Author:
Carter
Publisher:
McGraw Hill
Holt Mcdougal Larson Pre-algebra: Student Edition…
Algebra
ISBN:
9780547587776
Author:
HOLT MCDOUGAL
Publisher:
HOLT MCDOUGAL
College Algebra (MindTap Course List)
Algebra
ISBN:
9781305652231
Author:
R. David Gustafson, Jeff Hughes
Publisher:
Cengage Learning
Glencoe Algebra 1, Student Edition, 9780079039897…
Algebra
ISBN:
9780079039897
Author:
Carter
Publisher:
McGraw Hill