D Quantity nd curve and marginal private and social cost curves nt of Figure 9 are two circular red markers with a line between th draw a MCp + t curve on Figure 9. he markers with the mouse by clicking on them and dragging. u can tab to each marker and then use the keyboard arrow keys
D Quantity nd curve and marginal private and social cost curves nt of Figure 9 are two circular red markers with a line between th draw a MCp + t curve on Figure 9. he markers with the mouse by clicking on them and dragging. u can tab to each marker and then use the keyboard arrow keys

Essentials of Economics (MindTap Course List)
8th Edition
ISBN:9781337091992
Author:N. Gregory Mankiw
Publisher:N. Gregory Mankiw
Chapter10: Externalities
Section: Chapter Questions
Problem 2PA

Related questions
Question
Transcribed Image Text:MC₂ = S
Price
D
Quantity
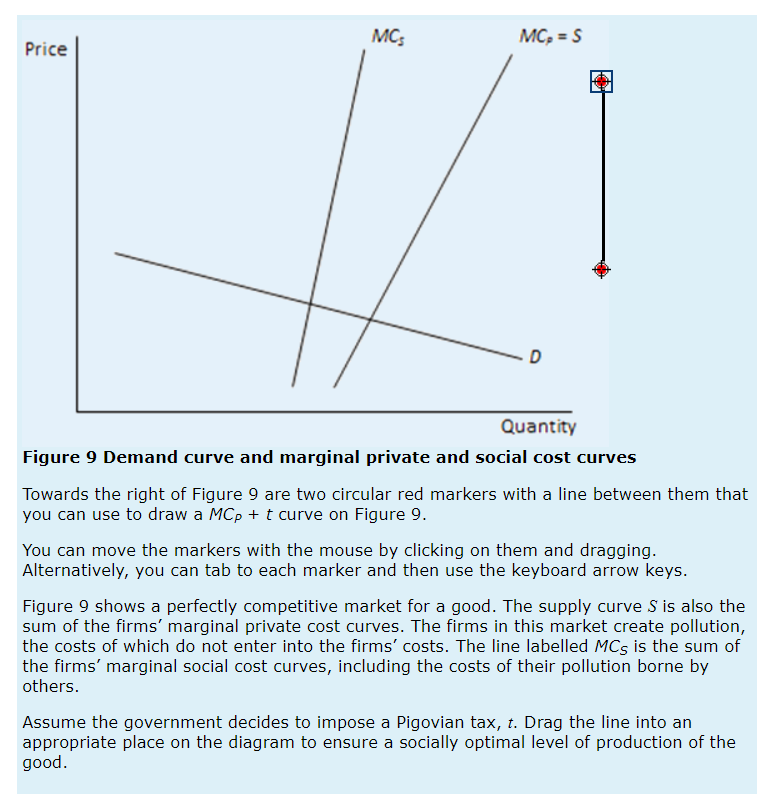
Figure 9 Demand curve and marginal private and social cost curves
Towards the right of Figure 9 are two circular red markers with a line between them that
you can use to draw a MCp + t curve on Figure 9.
You can move the markers with the mouse by clicking on them and dragging.
Alternatively, you can tab to each marker and then use the keyboard arrow keys.
Figure 9 shows a perfectly competitive market for a good. The supply curve S is also the
sum of the firms' marginal private cost curves. The firms in this market create pollution,
the costs of which do not enter into the firms' costs. The line labelled MCs is the sum of
the firms' marginal social cost curves, including the costs of their pollution borne by
others.
Assume the government decides to impose a Pigovian tax, t. Drag the line into an
appropriate place on the diagram to ensure a socially optimal level of production of the
good.
MC₂
Expert Solution
This question has been solved!
Explore an expertly crafted, step-by-step solution for a thorough understanding of key concepts.

Step by step
Solved in 2 steps with 1 images

Knowledge Booster


Learn more about
Need a deep-dive on the concept behind this application? Look no further. Learn more about this topic, economics and related others by exploring similar questions and additional content below.Recommended textbooks for you
Essentials of Economics (MindTap Course List)
Economics
ISBN:
9781337091992
Author:
N. Gregory Mankiw
Publisher:
Cengage Learning


Principles of Economics 2e
Economics
ISBN:
9781947172364
Author:
Steven A. Greenlaw; David Shapiro
Publisher:
OpenStax
Essentials of Economics (MindTap Course List)
Economics
ISBN:
9781337091992
Author:
N. Gregory Mankiw
Publisher:
Cengage Learning
Principles of Economics 2e
Economics
ISBN:
9781947172364
Author:
Steven A. Greenlaw; David Shapiro
Publisher:
OpenStax

Exploring Economics
Economics
ISBN:
9781544336329
Author:
Robert L. Sexton
Publisher:
SAGE Publications, Inc

Principles of Microeconomics
Economics
ISBN:
9781305156050
Author:
N. Gregory Mankiw
Publisher:
Cengage Learning
