d. Given C and I above, if government increases both G and T by 30, calculate equilibrium Y. e. Given Cand l above, if government only increased G by 30 (no change in T), calculate equilibrium Y. Given C and I above, if government only increased T by 30 (no change in G), calculate equilibrium Y. g. Why does the increase in G have a larger the effect on Y than the same increase in tax in absolute f. value terms?
d. Given C and I above, if government increases both G and T by 30, calculate equilibrium Y. e. Given Cand l above, if government only increased G by 30 (no change in T), calculate equilibrium Y. Given C and I above, if government only increased T by 30 (no change in G), calculate equilibrium Y. g. Why does the increase in G have a larger the effect on Y than the same increase in tax in absolute f. value terms?

Chapter11: Fiscal Policy
Section: Chapter Questions
Problem 1.4P

Related questions
Question
Hi! I badly need help me with letters D,E,F,G. Thank you so much.
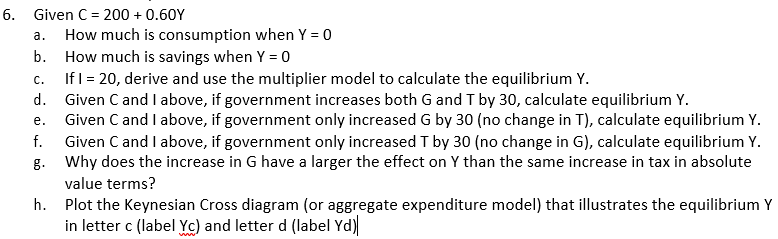
Transcribed Image Text:6. Given C = 200 + 0.60Y
How much is consumption when Y = 0
b. How much is savings when Y = 0
a.
с.
If I = 20, derive and use the multiplier model to calculate the equilibrium Y.
d. Given C and Ilabove, if government increases both G and T by 30, calculate equilibrium Y.
Given C and I above, if government only increased G by 30 (no change in T), calculate equilibrium Y.
Given C and I above, if government only increased T by 30 (no change in G), calculate equilibrium Y.
g. Why does the increase in G have a larger the effect on Y than the same increase in tax in absolute
е.
f.
value terms?
h. Plot the Keynesian Cross diagram (or aggregate expenditure model) that illustrates the equilibrium Y
in letter c (label Yc) and letter d (label Yd)
Expert Solution
This question has been solved!
Explore an expertly crafted, step-by-step solution for a thorough understanding of key concepts.

Step by step
Solved in 2 steps

Recommended textbooks for you


Macroeconomics: Principles and Policy (MindTap Co…
Economics
ISBN:
9781305280601
Author:
William J. Baumol, Alan S. Blinder
Publisher:
Cengage Learning
Macroeconomics: Principles and Policy (MindTap Co…
Economics
ISBN:
9781305280601
Author:
William J. Baumol, Alan S. Blinder
Publisher:
Cengage Learning

Brief Principles of Macroeconomics (MindTap Cours…
Economics
ISBN:
9781337091985
Author:
N. Gregory Mankiw
Publisher:
Cengage Learning

Essentials of Economics (MindTap Course List)
Economics
ISBN:
9781337091992
Author:
N. Gregory Mankiw
Publisher:
Cengage Learning

Exploring Economics
Economics
ISBN:
9781544336329
Author:
Robert L. Sexton
Publisher:
SAGE Publications, Inc