Data on advertising expenditures and revenue (in thousands of dollars) for the Four Seasons Restaurant follow. Advertising Expenditures Revenue 20 2 33 4 45 6 40 10 53 14 54 20 55 a. Let equal advertising expenditures and y equal revenue. Use the method of least squares to develop a straight line approximation of the relationship between the two variables (to 2 decimals). + b. Test whether revenue and advertising expenditures are related at a 0.05 level of significance. Compute the following (to 2 decimals). SSE SST SSR MSR MSE
Data on advertising expenditures and revenue (in thousands of dollars) for the Four Seasons Restaurant follow. Advertising Expenditures Revenue 20 2 33 4 45 6 40 10 53 14 54 20 55 a. Let equal advertising expenditures and y equal revenue. Use the method of least squares to develop a straight line approximation of the relationship between the two variables (to 2 decimals). + b. Test whether revenue and advertising expenditures are related at a 0.05 level of significance. Compute the following (to 2 decimals). SSE SST SSR MSR MSE

Linear Algebra: A Modern Introduction
4th Edition
ISBN:9781285463247
Author:David Poole
Publisher:David Poole
Chapter7: Distance And Approximation
Section7.3: Least Squares Approximation
Problem 29EQ

Related questions
Question
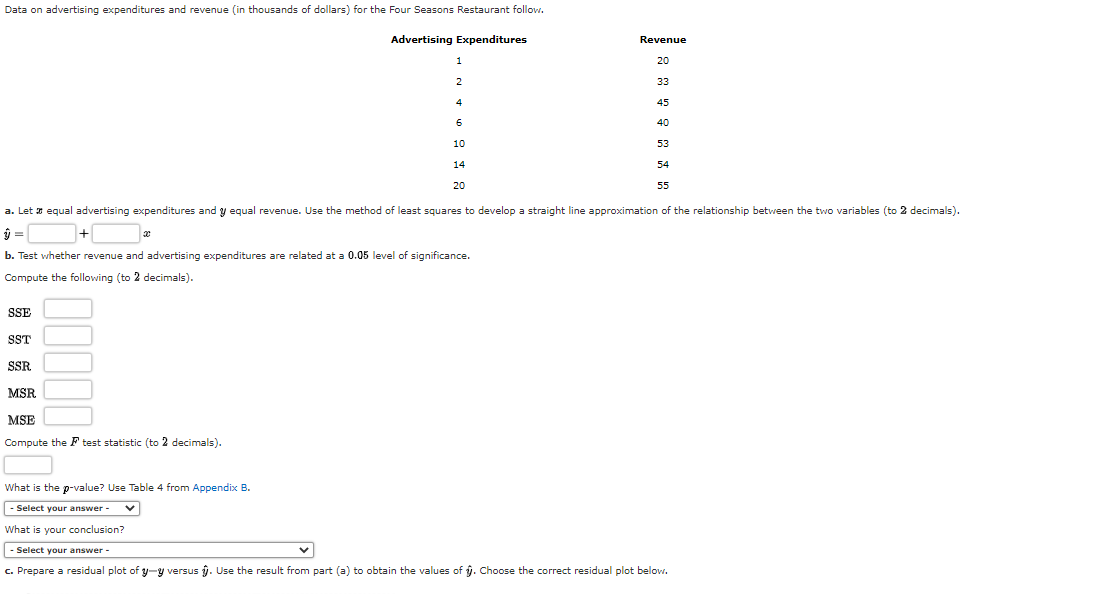
Transcribed Image Text:Data on advertising expenditures and revenue (in thousands of dollars) for the Four Seasons Restaurant follow.
Advertising Expenditures
Revenue
1
20
2
33
45
40
10
53
14
54
20
55
a. Let z equal advertising expenditures and y equal revenue. Use the method of least squares to develop a straight line approximation of the relationship between the two variables (to 2 decimals).
+
b. Test whether revenue and advertising expenditures are related at a 0.05 level of significance.
Compute the following (to 2 decimals).
SSE
SST
SSR
MSR
MSE
Compute the F test statistic (to 2 decimals).
What is the p-value? Use Table 4 from Appendix B.
- Select your answer -
What is your conclusion?
- Select your answer -
c. Prepare a residual plot of y-y versus y. Use the result from part (a) to obtain the values of ŷ. Choose the correct residual plot below.
Expert Solution
This question has been solved!
Explore an expertly crafted, step-by-step solution for a thorough understanding of key concepts.

This is a popular solution!

Trending now
This is a popular solution!

Step by step
Solved in 3 steps with 2 images

Recommended textbooks for you
Linear Algebra: A Modern Introduction
Algebra
ISBN:
9781285463247
Author:
David Poole
Publisher:
Cengage Learning

Elementary Linear Algebra (MindTap Course List)
Algebra
ISBN:
9781305658004
Author:
Ron Larson
Publisher:
Cengage Learning
Linear Algebra: A Modern Introduction
Algebra
ISBN:
9781285463247
Author:
David Poole
Publisher:
Cengage Learning
Elementary Linear Algebra (MindTap Course List)
Algebra
ISBN:
9781305658004
Author:
Ron Larson
Publisher:
Cengage Learning