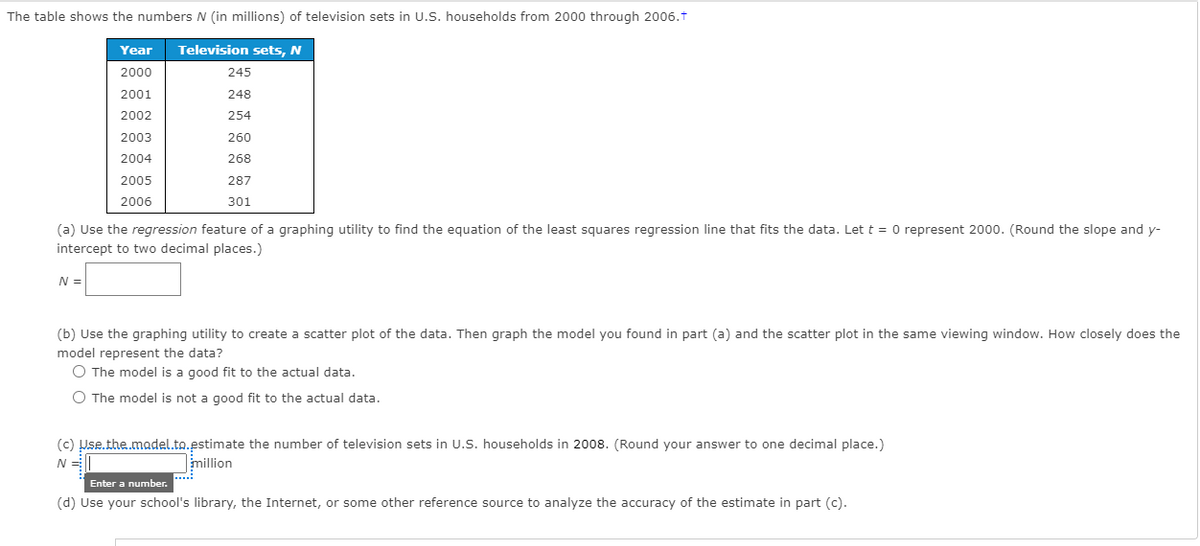
The table shows the numbers N (in millions) of television sets in U.S. households from 2000 through 2006.t Year Television sets, N 2000 245 2001 248 2002 254 2003 260 2004 268 2005 287 2006 301 (a) Use the regression feature of a graphing utility to find the equation of the least squares regression line that fits the data. Let t = 0 represent 2000. (Round the slope and y- intercept to two decimal places.) N = (b) Use the graphing utility to create a scatter plot of the data. Then graph the model you found in part (a) and the scatter plot in the same viewing window. How closely does the model represent the data? O The model is a good fit to the actual data. O The model is not a good fit to the actual data. (c) Pse.the.madel.to.estimate the number of television sets in U.S. households in 2008. (Round your answer to one decimal place.) N =| million Enter a number.


Correlation
Correlation defines a relationship between two independent variables. It tells the degree to which variables move in relation to each other. When two sets of data are related to each other, there is a correlation between them.
Linear Correlation
A correlation is used to determine the relationships between numerical and categorical variables. In other words, it is an indicator of how things are connected to one another. The correlation analysis is the study of how variables are related.
Regression Analysis
Regression analysis is a statistical method in which it estimates the relationship between a dependent variable and one or more independent variable. In simple terms dependent variable is called as outcome variable and independent variable is called as predictors. Regression analysis is one of the methods to find the trends in data. The independent variable used in Regression analysis is named Predictor variable. It offers data of an associated dependent variable regarding a particular outcome.


Trending now
This is a popular solution!

Step by step
Solved in 3 steps with 1 images


