
MATLAB: An Introduction with Applications
6th Edition
ISBN: 9781119256830
Author: Amos Gilat
Publisher: John Wiley & Sons Inc
expand_more
expand_more
format_list_bulleted
Related questions
Concept explainers
Question
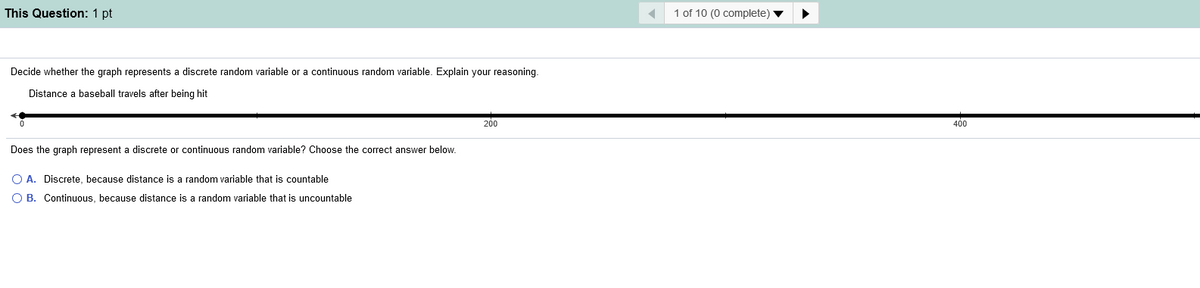

Transcribed Image Text:This Question: 1 pt
1 of 10 (0 complete)
Decide whether the graph represents a discrete random variable or a continuous random variable. Explain your reasoning.
Distance a baseball travels after being hit
200
400
Does the graph represent a discrete or continuous random variable? Choose the correct answer below.
O A. Discrete, because distance is a random variable that is countable
O B. Continuous, because distance is a random variable that is uncountable
Expert Solution
This question has been solved!
Explore an expertly crafted, step-by-step solution for a thorough understanding of key concepts.

This is a popular solution

Trending nowThis is a popular solution!

Step by stepSolved in 2 steps

Knowledge Booster


Learn more about
Need a deep-dive on the concept behind this application? Look no further. Learn more about this topic, statistics and related others by exploring similar questions and additional content below.Similar questions
- Lesson 10 Q4 The number of accidents in a week is ___________? A.a continuous random variable. B.a discrete random variable. C.neither continuous nor discrete variable. D.continuous and discrete variables.arrow_forwardDetermine whether the statement is true or false. If it is false, rewrite it as a true statement. The midpoint of a class is the sum of its lower and upper limits divided by two. Choose the correct answer below. OA. The statement is false. A true statement is "The midpoint of a class is the class frequency divided by the sample size." B. The statement is false. A true statement is "The midpoint of a class is the average of its lower and upper limits." OC. The statement is false. A true statement is "The midpoint of a class is the difference of its lower and upper limits divided by two." O D. The statement is true.arrow_forwardUse the given graph to find the mean,median, and mode of the distribution.arrow_forward
- Use the given graph to find the mean, median, and mode of the distribution. 10- 9- 8- 7- 6- 5- 7 8 9 10arrow_forwardYou see a game at a local fair. You have to throw a dart at a color wheel. Each section on the color wheel is equal in area. # 3 e d C Let B = the event of landing on blue. Let R = the event of landing on red. Let G = the event of landing on green. Let Y = the event of landing on yellow. a. C If you land on b. If you land on red, you don't $ 4 r f V % Y, Y, you get you get the biggest prize. Find P(Y). 5 t 8 b 6 Oll y get a prize. What is P(R)? h & 7 n J j * 8 3 ( 9 k O L 0 alt р { ctrl [ + ? 2 backs ] 1arrow_forwardPROB AND STATS DO NOW 1 DEPENDENT AND INDEPENDENT EVENTS MR.SAM Determine whether the events are independent or dependent. Explain. 1. A number cube is rolled twice, and an odd number is rolled each time. 3. 2. A bag contains several marbles. Alita selects a black marble, does not replace it, and then selects a yellow marble. CARDS A card is randomly chosen from a deck of 52 cards, replaced, and a second card is chosen. What is the probability of choosing both of the cards shown in the order shown? 59arrow_forward
- Do people walk faster in the airport when they are departing (getting on a plane) or do they walk faster when they are arriving (getting off a plane)? A reputable researcher measured the walking speed of random travelers in two International Airports. His findings are summarized in the table. Complete parts (a)-(c) below. E Click the icon to view the findings. a muIVIQudiS WdIK ai OlmereIL speeus uepenungUII WITEUTE Uiey die oeparng of diTIViny di tTE u – V. I1ever of sigiIcance? Le y tepieseni me fmeal| speed of people departing and p, represent the mean speed of people arriving. State the null and alternative hypothesis. A. Ho H1=H2 OB. Ho P1 - 2 H1 H1 > H2 Determine the P-value for this hypothesis test. P-value (Round to three decimal places as needed.) Enter your answer in the answer box and then click Check Answer. esarrow_forwardjust answer d pleasearrow_forward
arrow_back_ios
arrow_forward_ios
Recommended textbooks for you
- MATLAB: An Introduction with ApplicationsStatisticsISBN:9781119256830Author:Amos GilatPublisher:John Wiley & Sons Inc
 Probability and Statistics for Engineering and th...StatisticsISBN:9781305251809Author:Jay L. DevorePublisher:Cengage Learning
 Statistics for The Behavioral Sciences (MindTap C...StatisticsISBN:9781305504912Author:Frederick J Gravetter, Larry B. WallnauPublisher:Cengage Learning
  Elementary Statistics: Picturing the World (7th E...StatisticsISBN:9780134683416Author:Ron Larson, Betsy FarberPublisher:PEARSON
 The Basic Practice of StatisticsStatisticsISBN:9781319042578Author:David S. Moore, William I. Notz, Michael A. FlignerPublisher:W. H. Freeman
 Introduction to the Practice of StatisticsStatisticsISBN:9781319013387Author:David S. Moore, George P. McCabe, Bruce A. CraigPublisher:W. H. Freeman
MATLAB: An Introduction with Applications
Statistics
ISBN:9781119256830
Author:Amos Gilat
Publisher:John Wiley & Sons Inc
Probability and Statistics for Engineering and th...
Statistics
ISBN:9781305251809
Author:Jay L. Devore
Publisher:Cengage Learning
Statistics for The Behavioral Sciences (MindTap C...
Statistics
ISBN:9781305504912
Author:Frederick J Gravetter, Larry B. Wallnau
Publisher:Cengage Learning
Elementary Statistics: Picturing the World (7th E...
Statistics
ISBN:9780134683416
Author:Ron Larson, Betsy Farber
Publisher:PEARSON
The Basic Practice of Statistics
Statistics
ISBN:9781319042578
Author:David S. Moore, William I. Notz, Michael A. Fligner
Publisher:W. H. Freeman
Introduction to the Practice of Statistics
Statistics
ISBN:9781319013387
Author:David S. Moore, George P. McCabe, Bruce A. Craig
Publisher:W. H. Freeman