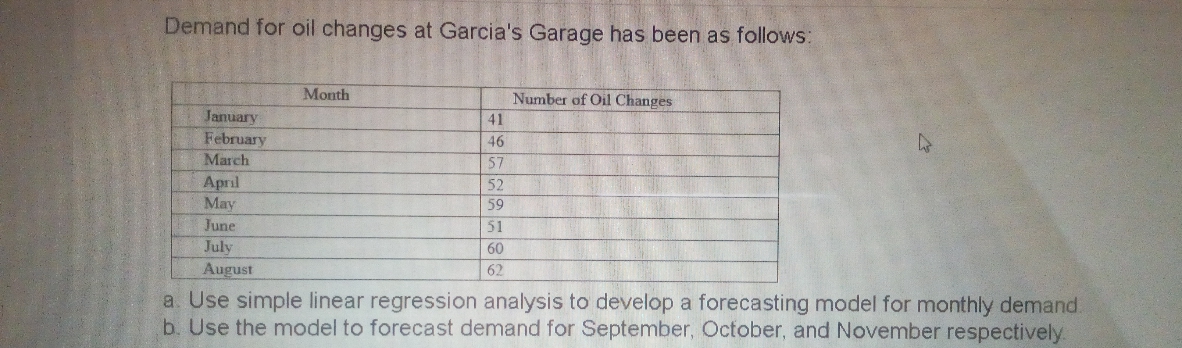
Demand for oil changes at Garcia's Garage has been as follows: Month Number of Oil Changes January 41 February 46 March 57 April May 52 59 June 51 July August 60 62 a. Use simple linear regression analysis to develop a forecasting model for monthly demand. b. Use the model to forecast demand for September, October, and November respectively
Q: Suppose you work for a software company and you would like to estimate the market value of your…
A: The independent variable is earnings. The dependent variable is market cap. We have to predict the…
Q: Consider the following data on the minimum temperatures in SLC by year. Create a linear regression…
A:
Q: OHaganBooks.com has tried selling novel through o'Books at a variety of prices, with the following…
A: The question is solved in next step
Q: 4.7 Consider the simple linear regression model fit to the weight and blood pressure data in.…
A: Residual explain the error happen in the data set. It is calculated by the difference of actual and…
Q: A university building produces the following data during a monitoring period. Calculate the…
A: Given : A university building produces the provided data during a monitoring period . The…
Q: 1. The table below lists U.S. fossil fuel consumption as a percentage of a total fuel consumption…
A:
Q: Consider the following time series data: Quarter Year 1 Year 2 Year 3 1 4 6 7 2 2 3 6 3 3 5 6 4 5 7…
A: Introduction: Denote the response variable, sales, as y.
Q: Based on the following data - (a) units produced from September to December are as follows: 18,900,…
A: The least squares regression equation is the best method for forecasting (or) prediction .The…
Q: OHaganBooks.com has tried selling novel through o'Books at a variety of prices, with the following…
A:
Q: given the information below: Row Education Income in in Years 2015 Dollars…
A: 1. The regression equation income = a + b (Education) Step-by-step procedure to obtain the…
Q: The Tile Shop owner wants to find out how education of his new hires interacts with sales. He is…
A: From the given tables;There are 7 observations.The process of fitting functions of data is knownas…
Q: An engineering student wants to study the impact of temperature and humidity on yield. The following…
A: Since you have posted a question with multiple sub-parts, we will solve first three subparts for…
Q: Suppose you work for a software company and you would like to estimate the market value of your…
A: The independent variable is earnings. The dependent variable is market cap. We have to find the…
Q: 1. The design life of a planned municipal water-distribution system is to end in 2050, and the…
A: The equation for the logistic model is given as Pt=PSat1+ea+b∆t. Where Pt=Population at time t in…
Q: 5) Since 1990, fireworks usage nationwide has grown, as shown in the accompanying table, where…
A:
Q: The following scatterplot shows a company's monthly sales,.. thousands of dollars, versus monthly…
A: High- Leverage Point:- A point on the scatter plot is said to be a high-leverage point if that point…
Q: Which of the following is a multiple linear regression model? O Y= Bo+B1x + B2x² OY =Bo+B1x O…
A: Let us determine which one of the above is a multiple linear regression model in the next step.
Q: The following data set contains information on years of formal education and incomes in 2015.…
A: Since you have posted a question with multiple subparts, we will solve first three subparts for you.…
Q: The following table shows data for the cost of natural gas in Maryland (in dollars per Million Btu)…
A: a). Here, the price can be predicted using the year. Therefore, the price is the response variable…
Q: Find the equation of the regression line from the following data. Price of a Commodity in RO 1 3…
A: Solution: Let X be the price of a commodity in RO and Y be the demand for the commodity. The given…
Q: Based on the residual plot, is the linear model appropriate? O No, there is no clear pattern in the…
A: The difference between the observed and predicted value is termed as residual. If the residuals in…
Q: Demand for oil changes at Garcia's Garage has been as follows:…
A: Introduction: We have obtained the regression equation using Excel. First, we have entered the data…
Q: 23: The accountant of Manama Corporation has collected the following data on its copy machine costs…
A: a) Plotting the points on graph from given data: From the given data the line of best fit is:…
Q: 4.7 Consider the simple linear regression model fit to the weight and blood pressure data in.…
A: Given data, Subject Weight Symbolic BP 1 165 130 2 167 133 3 180 150 4 155 128 5 212…
Q: 00 00 30 40 50 60 samp_reg$Age 00 8 20 30 40 50 60 samp_reg$Age resid(test) samp_reg$In_Income -0.5…
A: The conditions for the validity of a regression analysis are that the the error are normally…
Q: OHaganBooks.com has tried selling novel through o'Books at a variety of prices, with the following…
A: From given data, X Y X*Y X*X 7 616 4312 49 9.3 566 5263.8 86.49 10.2 417 4253.4 104.04…
Q: Consider the following estimated regression model relating annual salary to years of education and…
A: From the provided information, the regression equation is: Estimated…
Q: The following data describes weekly gross revenue (), television advertising expenditures (), and…
A:
Q: The table below gives the estimated world population (in billions) for various years. 1980 1990 1997…
A: x y X - Mx Y - My (X - Mx)2 (X - Mx)(Y - My) 198019901997200020052011…
Q: Number of Ordained Ministers in SF Number of Homicides in SF 1850 4 55 1860 9 75 1870 12 107 1880 28…
A:
Q: Demand for oil changes at Garcia's Garage has been as follows: Month January February March April…
A: Given data is Month Number of Oil changes January 34 February 50 March 60 April 45 May…
Q: A sales manager has collected the following data on annual sales (y) and years of experience (x) .…
A:
Q: 2. An article in the Tappi Journal (March, 1986) presented data on green liquor Na2S concentration…
A: From the above data A)
Q: the following table lists democrats spending thousands of dollars by statewide office and the…
A: Use the given data to form excel table: X Y X*Y X*X Y*Y 11.5 33.4 384.1 132.25 1115.56…
Q: The following table shows worldwide sales of a type of phone and their average selling prices in…
A: Consider the regression line q=mp+b. Where q is the demand or sales of the smartphones in billions,…
Q: 26. Erica, the manager at Stellarbeans, collected data on the daily high temperature and revenue…
A:
Q: A real estate agency collects data concerning the sales of a house (in thousands of dollars) and…
A: Equation of regression line is:
Q: The president of small manufacturing firm is concerned about the continual increase in manufacturing…
A: 1. Software procedure: Step-by-step software procedure to draw the time series plot using EXCEL:…
Q: 1. The following data set contains information on years of formal education and incomes in 2015.…
A: The regression is performed in Excel and the results are attached below, Enter the data -> Go to…
Q: The following data set contains information on years of formal education and incomes in 2015. Row…
A: Since you have asked multiple sub parts of the question, we will solve first three sub parts for…
Q: According to "Reproductive Biology of the Aquatic Salamander Amphiuma tridactylum in Louisiana,"†…
A: Solution Given Information
Q: bway ridership in Washington D. C. during the summer months is believed to be heavily tied to the…
A: Consider Number of Tourists (in millions) = X Ridership ( in 100,000) = Y We will use Excel to…
Q: 4.7 Consider the simple linear regression model fit to the weight and blood pressure data in.…
A: In order to study the relationship between weight and BP, the increase in weight of a person can…
Q: Develop an estimated multiple linear regression model that could be used to predict the alumni…
A: SUMMARY OUTPUT Regression Statistics Multiple R…
Q: OHaganBooks.com has tried selling novel through o'Books at a variety of prices, with the following…
A:
Q: A researcher is interested in knowing if there is a relationship between the years presented in the…
A: Let years be denoted by x and average family size be denoted by y. x y x-x y-y (x-x)(y-y) (x-x)2…
Q: 1) The accompanying table shows the enrollment of a preschool from 1980 through 2000. Write a linear…
A:
Correlation
Correlation defines a relationship between two independent variables. It tells the degree to which variables move in relation to each other. When two sets of data are related to each other, there is a correlation between them.
Linear Correlation
A correlation is used to determine the relationships between numerical and categorical variables. In other words, it is an indicator of how things are connected to one another. The correlation analysis is the study of how variables are related.
Regression Analysis
Regression analysis is a statistical method in which it estimates the relationship between a dependent variable and one or more independent variable. In simple terms dependent variable is called as outcome variable and independent variable is called as predictors. Regression analysis is one of the methods to find the trends in data. The independent variable used in Regression analysis is named Predictor variable. It offers data of an associated dependent variable regarding a particular outcome.
Trending now
This is a popular solution!
Step by step
Solved in 2 steps
- Olympic Pole Vault The graph in Figure 7 indicates that in recent years the winning Olympic men’s pole vault height has fallen below the value predicted by the regression line in Example 2. This might have occurred because when the pole vault was a new event there was much room for improvement in vaulters’ performances, whereas now even the best training can produce only incremental advances. Let’s see whether concentrating on more recent results gives a better predictor of future records. (a) Use the data in Table 2 (page 176) to complete the table of winning pole vault heights shown in the margin. (Note that we are using x=0 to correspond to the year 1972, where this restricted data set begins.) (b) Find the regression line for the data in part ‚(a). (c) Plot the data and the regression line on the same axes. Does the regression line seem to provide a good model for the data? (d) What does the regression line predict as the winning pole vault height for the 2012 Olympics? Compare this predicted value to the actual 2012 winning height of 5.97 m, as described on page 177. Has this new regression line provided a better prediction than the line in Example 2?Suppose a study wants to predict the market price of a certain species of turtle (Y) based on the following independent variables indicated in the table. Based from the table, what is the equation of the multiple linear regression? (Round off up to two decimal places. Market Price = 0.07 - 0.40*weight + 1.51*length + 1.41*width + 0.80*age Market Price = - 0.40*weight + 1.51*length + 1.41*width + 0.80*age Market Price = 0.07 + 0.40*weight + 1.51*length + 1.41*width + 0.80*age Market Price = 0.07 - 0.40 + weight + 1.51 + length + 1.41 + width + 0.80 + ageThe monthly premium quoted by an insurance company for a critical illness policy was collected from a sample of 6 adult male smokers at different age. The data for the sample are shown: Age 28 25 50 39 47 31 Premium ($) 75 40 175 125 250 105 Using Age to predict premium, the Linear Regression equation is given by: ŷ =6.556X−112 and r2=0.813y^=6.556X−112 and r2=0.813 a. Identify the independent and Dependent variables. Dependent: Age Premium Independent: Age Premium b. Determine the slope. Slope = Slope = Round to 3 decimal places c. Determine |r||r| . |r|=|r|= Round to 3 decimal places d. Interpret rr : and e. Determine critical r value at 5% significance level and determine if there is a significant linear correlation exists. |r| critical=|r| critical= Round to 3 decimal places Linear Correlation:Linear Correlation: Significant Not Significant f. Predict the monthly premium for a 40 years old adult male smoker.…
- The president of small manufacturing firm is concerned about the continual increase in manufacturing costs over the past several years. The following figures provide a time series of the cost per unit for the firm’s leading product over the past eight years. Year Cost/Unit ($) Year Cost/Unit ($) 1 20.00 5 26.60 2 24.50 6 30.00 3 28.20 7 31.00 4 27.50 8 36.00 Construct a time series plot. What type of pattern exists in the data? Use simple linear regression analysis to find the parameters for the line that minimizes MSE for this time series. What is the average cost increase that the firm has been realizing per year? Compute an estimate of the cost/unit for next year.Life insurance companies are keenly interested in predicting how long their customers are likely to live, because this will determine their premiums and ultimately their profitability. An Australian life insurance company is interested in the relationship, if any, between the age at death of their male customers and that of the customer’s father. Data are collected on a random sample of 100 of their male customers who have recently died. The customer’s age at death was plotted against that of their father and a linear regression model applied. Relevant output is shown below. Say how you know from the output that there actually is a significant linear relationship between a male customer’s age at death and his father’s age at death. State the value of the coefficient of Father’s Age (Death) and interpret this value in the context of the problem at hand.State the value of the coefficient of determination in the model and interpret this value in the context of the situation.Life insurance companies are keenly interested in predicting how long their customers are likely to live, because this will determine their premiums and ultimately their profitability. An Australian life insurance company is interested in the relationship, if any, between the age at death of their male customers and that of the customer’s father. Data are collected on a random sample of 100 of their male customers who have recently died. The customer’s age at death was plotted against that of their father and a linear regression model applied. Relevant output is shown below Examine both the scatterplot and the correlation matrix provided above. Comment on the apparent relationship between the customer’s age at death and their father’s age at death in the plot. Explain how the information in the correlation matrix supports your conclusion
- The owner of Original Italian Pizza restaurant chain wants to understand which variable most strongly influences the sales of his specialty deep-dish pizza. He has gathered data on the monthly sales of deep-dish pizzas at his restaurants and observations on other potentially relevant variables for each of several outlets in central Indiana. These data are provided in the file P10_04.xlsx. Estimate a simple linear regression equation between the quantity sold (Y) and each of the following candidates for the best explanatory variable: average price of deep-dish pizzas (X1), monthly advertising expenditures (X2), and disposable income per household in the areas surrounding the outlets (X3). Round your answers for intercept coefficients to the nearest whole number and slope coefficients to two decimal places, if necessary. If your answer is negative number, enter "minus" sign.A medical researcher wishes to determine how the dosage (in milliliters) of an experimental drugaffects the heart rate (in beats per minute) of patients with an elevated heart rate. The data for asample of eight patients with an elevated heart rate are provided in the following table.Drug Dosage 0 5 10 20 25 30 40 50Heart Rate 135 124 106 89 85 72 68 62(a) Determine the linear regression model that will best predict a patient’s heart rate based on thedosage of the drug received. (b) How well does the linear regression model fit this sample data? (c) If a patient with an elevated heart rate is administered a 35 ml dose of this drug, predict theresulting heart rate of the patient.Cafe michigans manager, gary starkm suspects that demand for mocha latte coffees depends on the price being charged. Based on historical observations, Gary has gathered the following data, which show the number of thesse coffees sold over six different price values: Price number sold $2.70 760 $3.50 510 $2.00 980 $4.20 250 $3.10 320 $4.05 480 Using simple linear regression and given that the price per cup is $2.80 the forecasted demand for mocha latte coffees will be [__] cups (enter your response rounded to one decimal place)
- Develop an estimated multiple linear regression model that could be used to predict the alumni giving rate using the graduation, % of Classes Under 20 (LT20), and Student/Faculty Ratio (SFR) as independent variables. Discuss your findings. School SFR LT20 GT50 GRAD FRR GIVE Arizona State 24 42% 16% 59% 81% 8% Arkansas State—Jonesboro 19 49% 4% 37% 69% 11% Auburn 18 24% 17% 66% 87% 31% Air Force 8 74% 0.10% 81% 88% 11% Military Academy 8 95% 0% 86% 92% 28% Akron 20 39% 6% 35% 69% 15% Arizona 20 35% 17% 60% 79% 5% Arkansas 18 28% 18% 58% 83% 23% Ball State 18 34% 12% 57% 78% 11% Baylor 14 49% 9% 71% 85% 14% Boise State 21 33% 11% 27% 67% 8% Boston College 14 47% 6% 91% 96% 27% Bowling Green State 19 33% 7% 61% 75% 8% BYU 21 46% 12% 78% 84% 17% SUNY 16 36% 21% 67% 88% 9% Alabama 19 46% 16% 67% 85% 34% Central Michigan 22 32% 11% 54% 78% 8% Clemson 16 51% 13% 76% 91% 28% Colorado State 18 34% 19% 64% 83% 7% Berkley 17 62% 15% 91% 97% 12%…An online market evaluation company e-Serve collects data and provides analytic solutions for sales promotion. A subsample of e-Serve for promotion expenditure and sales of several ecommerce businesses in million taka are provided below.Promotion 22 15 4 4 7 10 12 15 17 15Sales 150 100 80 100 90 120 110 120 130 140(a) Show that a simple linear regression model can be fitted with these variables and state a linear model for these variables. How the least square method is used to estimate parameters in a linear regression model?(b) At 5% level of significance test the hypothesis that the correlation is not positive. Based on the test result comment on the sign of the regression coefficient.(c) Find the regression line of sales on promotion expenditure by estimating parameters. Also, test the significance of slope coefficient at 5% level.(d) Find the 95% confidence interval for the mean sales with promotion expenditure of 7 million taka and comment on your results.The Pilot Pen Company has decided to use 15 test markets to examine the sensitivity of demand for its new product to various prices, as shown in the following table. Advertising effort was identical in each market. Each market had approximately the same level of business activity and population.a. Using a linear regression model, estimate the demand function for Pilot’s new pen.b. Evaluate this model by computing the coefficient of determination and by performing a t-test of the significance of the price variable.c. What is the price elasticity of demand at a price of 50 cents? TEST MARKET PRICE CHARGED (¢) QUANTITY SOLD(THOUSANDS OF PENS) 1 2 3 4 5 6 7 8 9 10 11 12 13 14 15 50 50 55 55 60 60 65 65 70 70¢ 80 80 90¢ 90 40 20.0 21.0 19.0 19.5 20.5 19.0 16.0 15.0 14.5 15.5 13.0 14.0 11.5 11.0 17.0