Determine the critical value. A local retailer currently schedules employees based on the assumption that they serve customers uniformly throughout the week (the same number each day). Management is starting to question this assumption and decides to collect data on the number of customers served each day of the week to perform a Chi-Square goodness-of-fit test at a 5% significance level. 13. Monday Tuesday Wednesday Thursday Friday Total 200 Number Served 40 33 35 32 60 Provided the assumptions of the test are satisfied, determine the critical value for the test. a) 12.59 b) 7.81 c) 5.99 d) 3.84 e) 9.49 Determine the expected count under the null hypothesis. stomers
Determine the critical value. A local retailer currently schedules employees based on the assumption that they serve customers uniformly throughout the week (the same number each day). Management is starting to question this assumption and decides to collect data on the number of customers served each day of the week to perform a Chi-Square goodness-of-fit test at a 5% significance level. 13. Monday Tuesday Wednesday Thursday Friday Total 200 Number Served 40 33 35 32 60 Provided the assumptions of the test are satisfied, determine the critical value for the test. a) 12.59 b) 7.81 c) 5.99 d) 3.84 e) 9.49 Determine the expected count under the null hypothesis. stomers

Glencoe Algebra 1, Student Edition, 9780079039897, 0079039898, 2018
18th Edition
ISBN:9780079039897
Author:Carter
Publisher:Carter
Chapter10: Statistics
Section10.3: Measures Of Spread
Problem 1GP

Related questions
Question
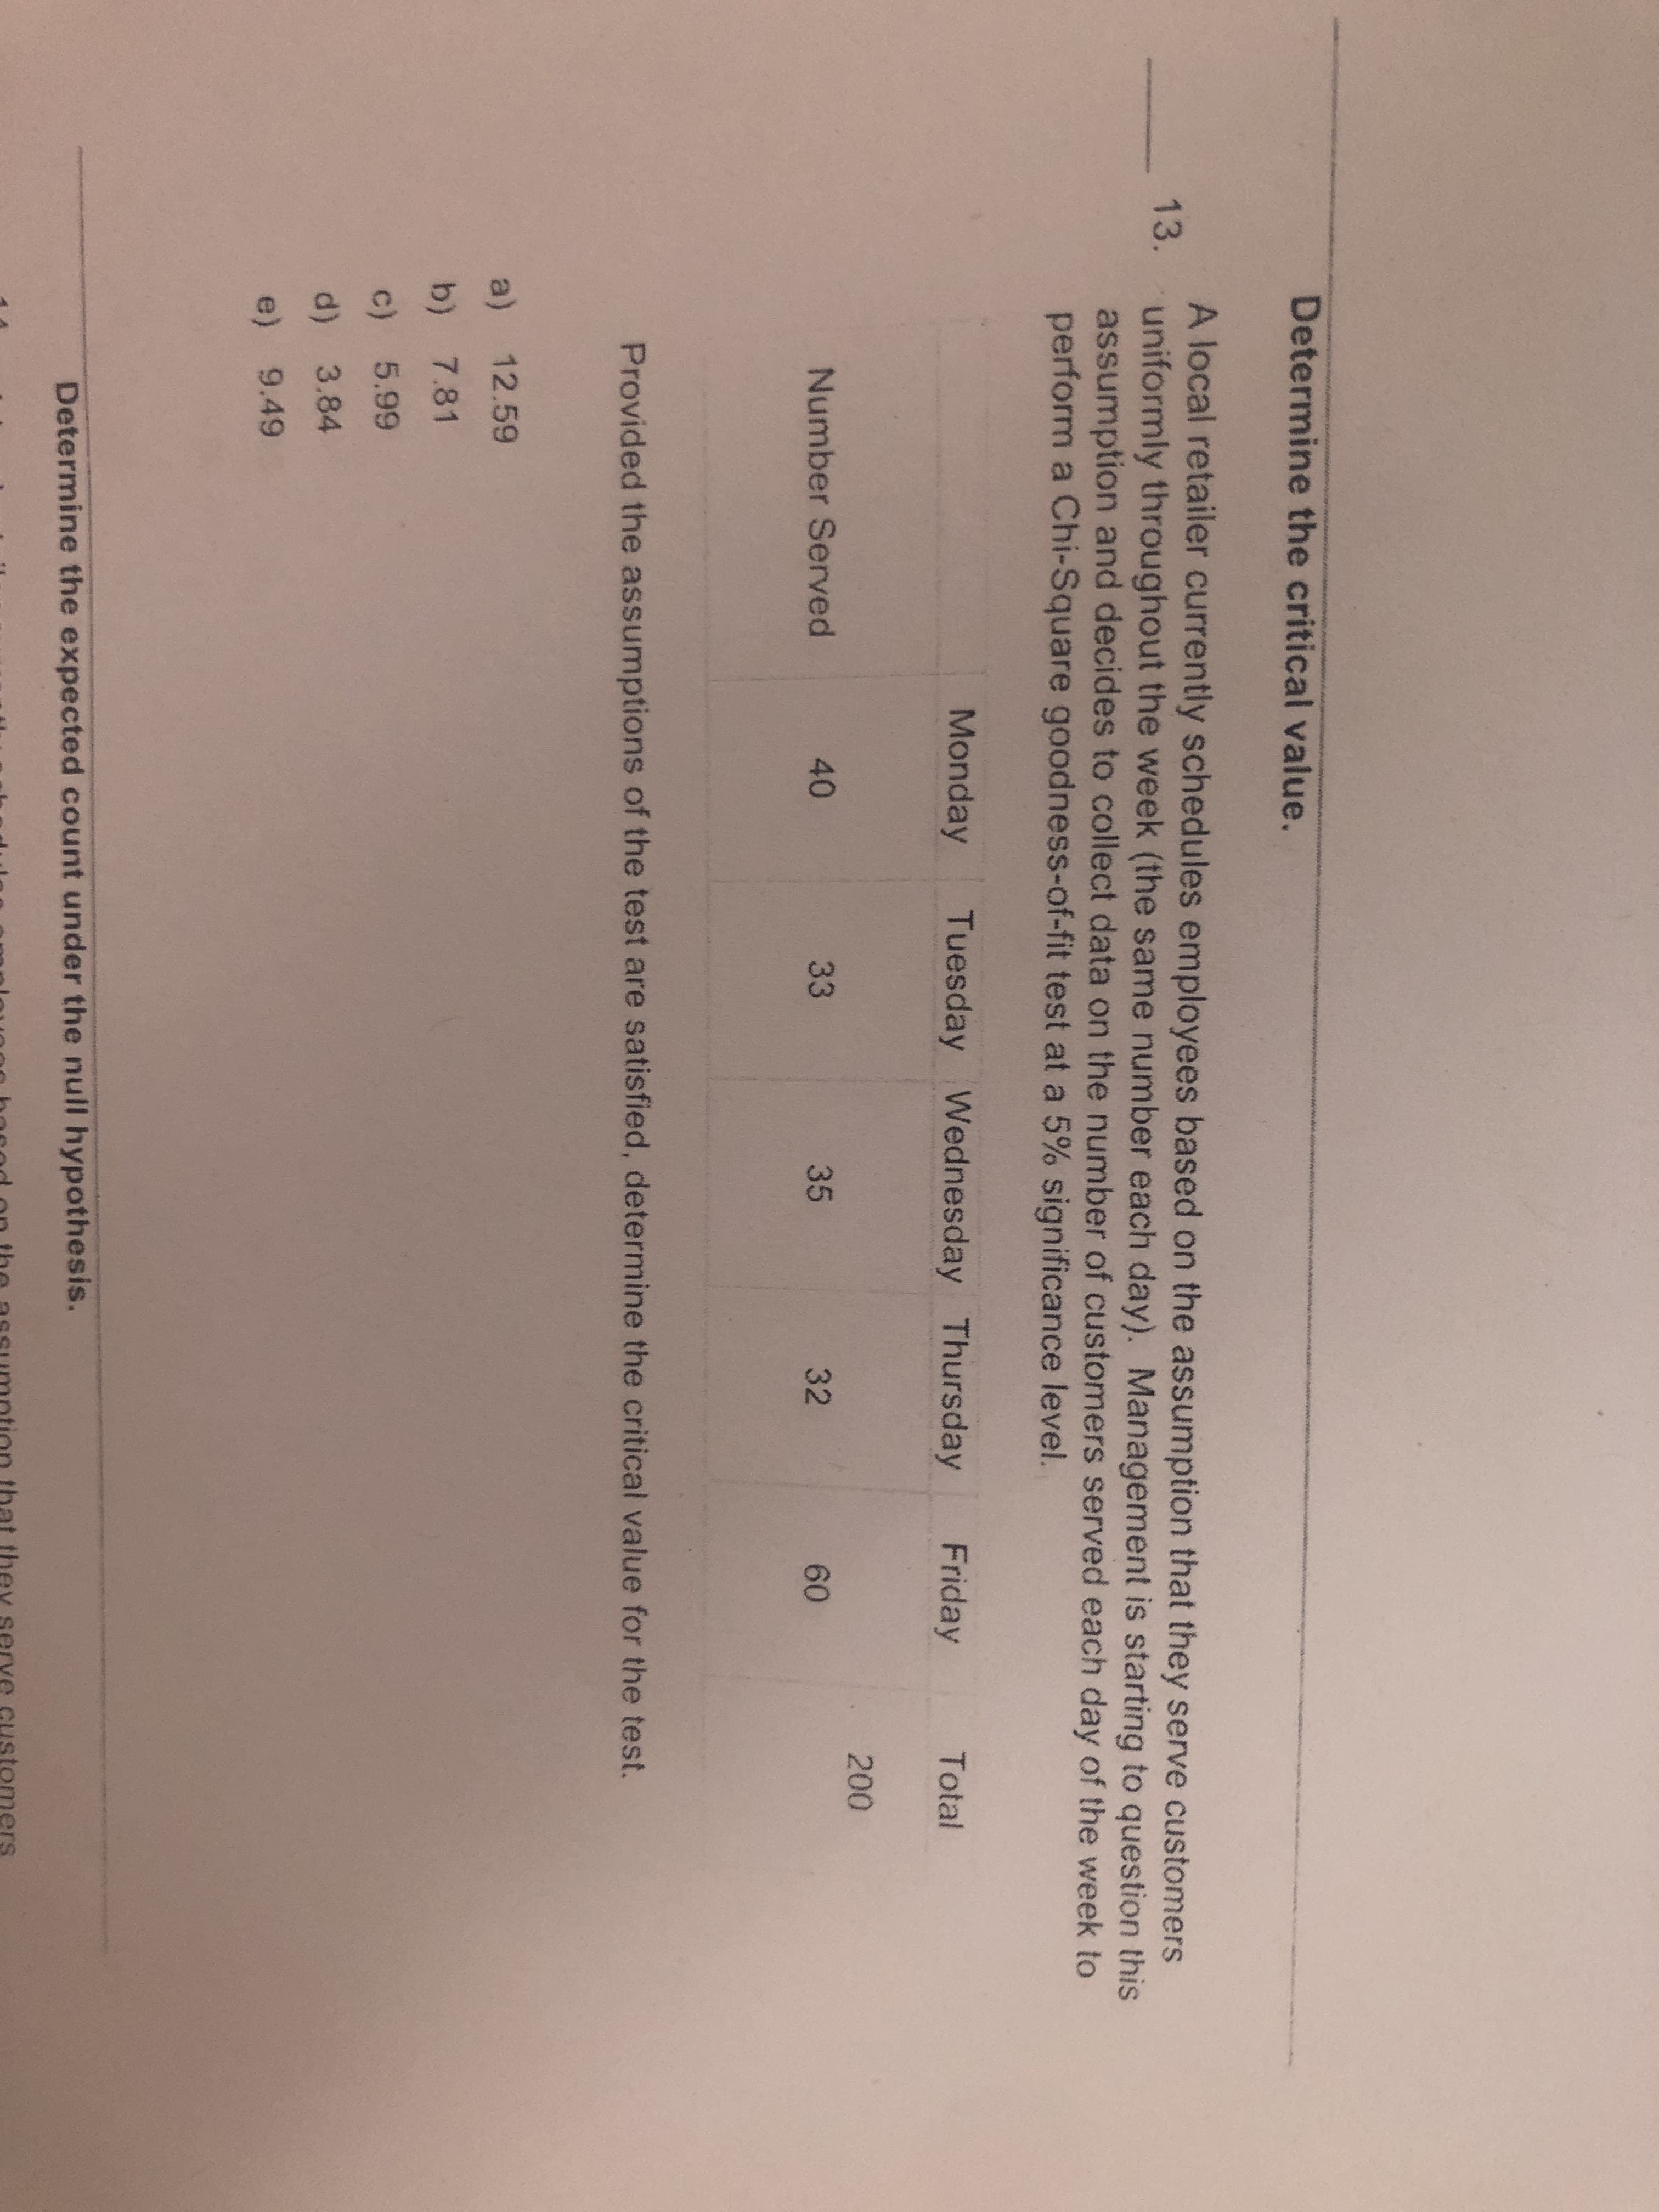
Transcribed Image Text:Determine the critical value.
A local retailer currently schedules employees based on the assumption that they serve customers
uniformly throughout the week (the same number each day). Management is starting to question this
assumption and decides to collect data on the number of customers served each day of the week to
perform a Chi-Square goodness-of-fit test at a 5% significance level.
13.
Monday
Tuesday Wednesday Thursday
Friday
Total
200
Number Served
40
33
35
32
60
Provided the assumptions of the test are satisfied, determine the critical value for the test.
a) 12.59
b) 7.81
c) 5.99
d) 3.84
e) 9.49
Determine the expected count under the null hypothesis.
stomers
Expert Solution
This question has been solved!
Explore an expertly crafted, step-by-step solution for a thorough understanding of key concepts.

This is a popular solution!

Trending now
This is a popular solution!

Step by step
Solved in 3 steps with 3 images

Recommended textbooks for you
Glencoe Algebra 1, Student Edition, 9780079039897…
Algebra
ISBN:
9780079039897
Author:
Carter
Publisher:
McGraw Hill
Glencoe Algebra 1, Student Edition, 9780079039897…
Algebra
ISBN:
9780079039897
Author:
Carter
Publisher:
McGraw Hill