
MATLAB: An Introduction with Applications
6th Edition
ISBN: 9781119256830
Author: Amos Gilat
Publisher: John Wiley & Sons Inc
expand_more
expand_more
format_list_bulleted
Related questions
Question
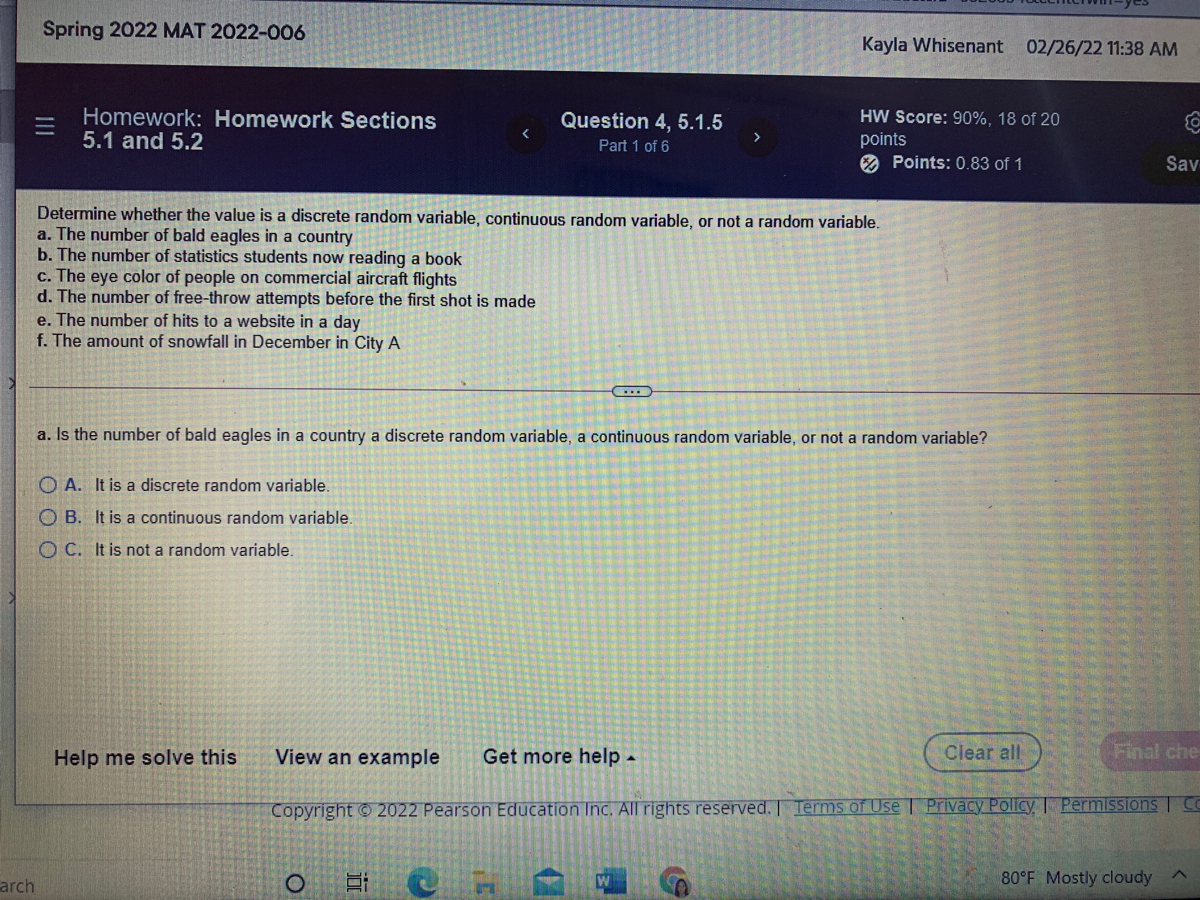

Transcribed Image Text:Spring 2022 MAT 2022-006
Kayla Whisenant 02/26/22 11:38 AM
Homework: Homework Sections
5.1 and 5.2
HW Score: 90%, 18 of 20
Question 4, 5.1.5
Part 1 of 6
points
O Points: 0.83 of 1
Sav
Determine whether the value is a discrete random variable, continuous random variable, or not a random variable.
a. The number of bald eagles in a country
b. The number of statistics students now reading a book
c. The eye color of people on commercial aircraft flights
d. The number of free-throw attempts before the first shot is made
e. The number of hits to a website in a day
f. The amount of snowfall in December in City A
a. Is the number of bald eagles in a country a discrete random variable, a continuous random variable, or not a random variable?
O A. It is a discrete random variable.
O B. It is a continuous random variable.
O C. It is not a random variable.
Help me solve this
View an example
Get more help -
Clear all
Final che
Co
Copyright 2022 Pearson Education Inc. All rights reserved. | Terms of Use Privacy Policy Permissions
80°F Mostly cloudy
arch
Expert Solution
This question has been solved!
Explore an expertly crafted, step-by-step solution for a thorough understanding of key concepts.

This is a popular solution

Trending nowThis is a popular solution!

Step by stepSolved in 2 steps

Knowledge Booster

Similar questions
- You are studying objects from four groups: A, B, C, and D. You take measurements on each object in the groups. 243 a. The middle 50% of objects in group B have a measurement between and b. Which group has the largest range? c. The median of group C isarrow_forwardB 4 points A researcher collects data from four groups that each have 5 different individuals. The sum of square within group was calculated to be 162.40 and the mean squares within value was 10.15. How many degrees of freedom are there? Type your answer... DOarrow_forwardTwo dice are rolled and the faces are added together. Give your answer as a decimal out to at least 4 places. a. What is the probability of getting a sum of eight? b. What is the probability of getting doubles? c. What is the probability of getting a sum more than ten?arrow_forward
- 2. The grade in Mathematics of the 10 Grade 8 students for the first quarter are: 89, 83, 93, 92, 88, 87, 95, 86, 90, and 91. Find the mean, median, and mode. a. Mean b. Median c. Modearrow_forwarda. Write the claim identifying H0 Ha B.find P value C. Decided whether to reject or fail d. Interpret the decision in the contextarrow_forwardEye Color f % Amber 5 4.81% Blue 8 7.69% Brown 82 78.85% Gray 3 2.88% Green 2 1.92% Hazel 3 2.88% Red/Violet 1 0.96% Total 104 100.00% Comment on your findingarrow_forward
- A categorical variable has three categories, with the frequencies of occurrence below. a. Compute the percentage of values in each category. b. What conclusions can you reach concerning the categories? Category Frequency A 9 B 26 C 15arrow_forwardR A veterinarian recorded how many kittens were born in each litter. This data is summarized in the L histogram below. (Note: The last class actually represents "7 or more kittens," not just 7 kittens.) 14 12 10- 8- 6- 4 1 2 3 4 7 8 # of kittens What is the frequency of litters having at most 3 kittens? ans = Fe Ro 1 FEB 18 P. W MacBook Air 20 000 esc F5 F6 F2 F3 F4 F1 & ! @ 1 2 4 5 Q W R %24 # 3 6 2. Frequencyarrow_forward6. Create a probability distribution for a coin flipping game. That is, tossa coin at least 25 times and keep up with the number of heads and the number of tails. a. Compile your data into a probability distribution. Be sure to show that your distribution meets the properties for a probability distribution. b. Use a bar graph to graph the distribution. c. Explain the random variables for your data. d. Did the values come out as you would expect? Explain what you would expect to happen with the outcome of the game versus the actual expected value of your distribution. 7. Use your example from question 6 to set up a binomial distribution. Find the probability based on your data that if the coin is flipped 25 times, what is the probability that a heads would appear 10 times or less. 8. The following information has been given that shows the highest level of education received by employees of a company. Ph.D. Master's Bachelor's Associate # Employees 8 21 33 18 High School Diploma 7 Other…arrow_forward
- Information about a sample is used to make a prediction about the population. This type of statistical analysis is referred to as: Descriptive Statistics Mathematical Certainty Deductive Reasoning Inferential Statistics Sampling Statisticsarrow_forwardNonearrow_forwardshow work and why it might be negative if you get negative number please thank youarrow_forward
arrow_back_ios
SEE MORE QUESTIONS
arrow_forward_ios
Recommended textbooks for you
- MATLAB: An Introduction with ApplicationsStatisticsISBN:9781119256830Author:Amos GilatPublisher:John Wiley & Sons Inc
 Probability and Statistics for Engineering and th...StatisticsISBN:9781305251809Author:Jay L. DevorePublisher:Cengage Learning
 Statistics for The Behavioral Sciences (MindTap C...StatisticsISBN:9781305504912Author:Frederick J Gravetter, Larry B. WallnauPublisher:Cengage Learning
  Elementary Statistics: Picturing the World (7th E...StatisticsISBN:9780134683416Author:Ron Larson, Betsy FarberPublisher:PEARSON
 The Basic Practice of StatisticsStatisticsISBN:9781319042578Author:David S. Moore, William I. Notz, Michael A. FlignerPublisher:W. H. Freeman
 Introduction to the Practice of StatisticsStatisticsISBN:9781319013387Author:David S. Moore, George P. McCabe, Bruce A. CraigPublisher:W. H. Freeman
MATLAB: An Introduction with Applications
Statistics
ISBN:9781119256830
Author:Amos Gilat
Publisher:John Wiley & Sons Inc
Probability and Statistics for Engineering and th...
Statistics
ISBN:9781305251809
Author:Jay L. Devore
Publisher:Cengage Learning
Statistics for The Behavioral Sciences (MindTap C...
Statistics
ISBN:9781305504912
Author:Frederick J Gravetter, Larry B. Wallnau
Publisher:Cengage Learning
Elementary Statistics: Picturing the World (7th E...
Statistics
ISBN:9780134683416
Author:Ron Larson, Betsy Farber
Publisher:PEARSON
The Basic Practice of Statistics
Statistics
ISBN:9781319042578
Author:David S. Moore, William I. Notz, Michael A. Fligner
Publisher:W. H. Freeman
Introduction to the Practice of Statistics
Statistics
ISBN:9781319013387
Author:David S. Moore, George P. McCabe, Bruce A. Craig
Publisher:W. H. Freeman