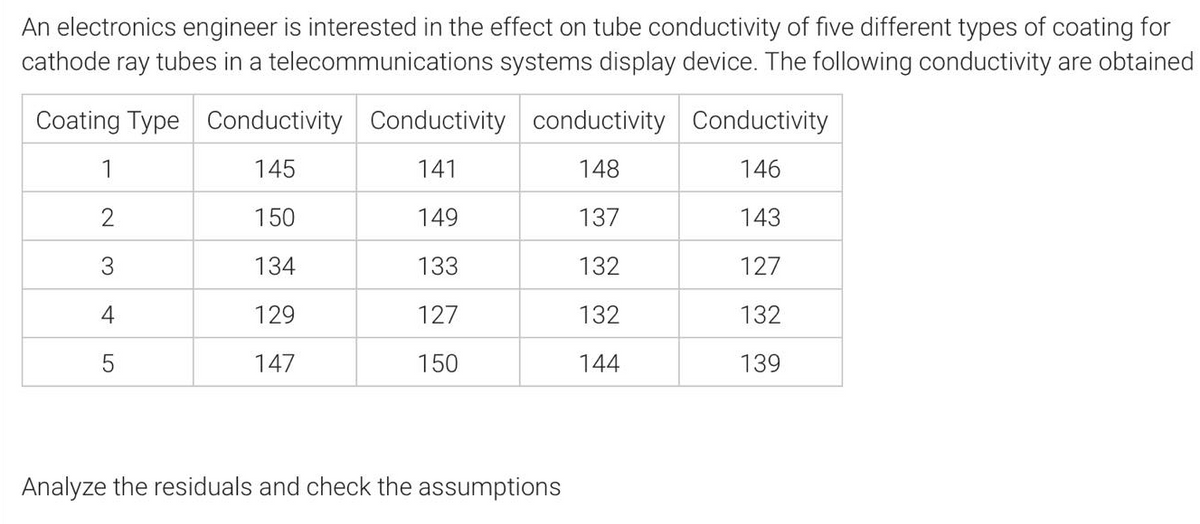
e ray tubes in a telecommunications systems display device. The following conductivity are ng Type Conductivity Conductivity conductivity Conductivity 1 145 141 148 146 2 150 149 137 143 3 134 133 132 127 4 129 127 132 132 147 150 144 139


Q: 10. The lengths of the 575 iron rods in a blacksmith's workshop are shown in the histogram below:…
A: Given histogram representing lengths of 575 iron rods as shown below
Q: Data was collected for 300 fish from the North Atlantic. The length of the fish (in mm) is…
A: We subtract the upper value of first calss from the lower value of 2nd class then we divide it by 2.…
Q: Pigmented makeup products like mascara and eye shadow may contain metal (e.g., nickel) allergens. Is…
A: From the provided information, Sample size (n) = 138 From which 11 were diagnosed with a nickel…
Q: t P t P 0:00 1818 3:30 1617 0:30 1731 4:00 1627 1:00 1688 4:30 1662 1:30 1642 5:00 1743 2:00 1639…
A:
Q: you work as a procurement engineer in a company that produces electronic device; your manager asked…
A: Note: Hi there! Thank you for posting the question. As there are multiple sub-parts, according to…
Q: 0.22 0.23 0.33 0.50 0.55 0.58 0.62 0.63 0.72 0.89 Use the accompanying radiation levels in for 50…
A: Calculate Quartile-1 from the following…
Q: # Of ID Weight Systolic Pressure 1 120 126 145 120 3 118 128 4 162 129 106 119 143 136 • Weight –…
A: Mean : In statistics , mean is the average of number of observations. Average is the sum of…
Q: Andlya's Dai Effect of perfume type on bee's behavior Perfume type Number of bees that left the hive…
A:
Q: Which of the following statement is correct about lower limit in the frequency d O a. The lower…
A: We know that, The lower class limit of a class is the smallest data value that can go into the…
Q: A student is studying the migration pattems of several birds. She collects the data in the table.…
A: Given that a student is studying the migration patterns of several birds. She collects the data in…
Q: In a statistical study, the summary data are given as follows n = 35, I= 5, y=4 XY = 1000 yi = 1900…
A:
Q: 35. Which statement below accurately describes the relationship between the alpha level, the size of…
A: We have given the following statement the relationship between the alpha level, the size of the…
Q: A study collects samples of water from the tap in Vacaville and from bottled water available from…
A: The observed pH value is 6.32.The mean pH of Tap water is calculated as follows:
Q: ases of Wine Sold at Five Price Levels ses Sold per 10,000 pulation Price per Bottle 23, 21 $10 19,…
A: The given data is Cases Sold per 10,000 Population Price per Bottle 23, 21 $10 19, 18 11…
Q: Construct a 99% confidence interval for the mean lead level in water specimans of the…
A:
Q: 1. In the table below indicate for each column the measurement level Month of Temperature Weight in…
A: There are four levels of measurements which are given by, 1. Nominal : levels the categorical…
Q: A basketball player makes 70% of attempted free throws, The basketball player attempts five 5 shots.…
A:
Q: 22. Determine what the key terms below refer to in the following study. (6pts) We want to know the…
A: Solution: Note: Hello! As you have posted more than 3 sub parts, we are answering the first 3…
Q: The following are goals scored by a soccer team at each game in their recent season. 0 0 0 0 0 0 0…
A:
Q: uicm witn weighied mean. Town A Town B Schools No. of teachers Rate of No. of teachers Rate of…
A:
Q: 29. Eleven cities are ranked according the their pollution levels and occurrence of pulmonary…
A:
Q: W for 50 different cell phones. Find kg 0.27 0.28 0.33 0.50 0.57 0.58 0.64 0.70 0.73 0.87 Use the…
A: Calculate Percentiles-50 from the following…
Q: In the figure below, How many measurements in a data set that subject to a random error and lies in…
A: We've to find that, P(-2.38<Z<2.36)' =1- P(-2.38<Z)- P(Z<2.36) =1-…
Q: upper class limit for the third class?
A: Given that Data was collected for 300 fish from the North Atlantic .The length of the fish (in mm)…
Q: Carbon Monoxide Tar (mg) weight (g) 13.6 14.1 0.9853 16.6 16 1.0938 23.5 29.8 1.165 10.2 8 0.928 5.4…
A: Given Information:
Q: The histogram below gives the number of days that a group of homes was on the market last year…
A: Given that : A histogram is given firstly make a frequency distribution and find relative frequency…
Q: C. you work as a procurement engineer in a company that produces electronic device; your manager…
A: 1. The mean and standard deviation are, Mean: Thus, the mean of the resistance is 9.996 KΩ.…
Q: 29%, CBS 28%, NBC 25%, and independents 18%. A sample of 300 homes two weeks after a Saturday night…
A: Given See the handwritten solution
Q: 86 22. From, the information given below calculate Karl Pearson's coefficient of skewness and also…
A:
Q: REVIEW: DIFFENENTIATE THE FOLLOWING किमोि 2 2. y = メ+5 WE TAE APPNO PRLATE ト mlA
A: Upon simplifying:y=x4x+1We know that (uv)'=u'v+v'u and…
Q: In an experiment designed to monitor impedance to leg movement, Korean engineers attached electrodes…
A: Given that in an experiment designed to monitor impedance to leg movement, electrodes were attached…
Q: + | 8 O 3/ 3 100% Temalese 20 O Male crabs A Female crabs 80 o DD OO 00 35 40 45 50 25 30 Carapace…
A: Here the two variables are Rear width and Carapace width of crabs measured in mm. As width is given…
Q: A new industrial oven has just been installed at the Piatt Bakery. To develop experience regarding…
A: Given Information: The researcher observed the temperature at four place inside oven Time/Reading…
Q: 19. The following table contains the completion times in minutes of a race of 70 athletes. Complete…
A: Class width = upper limit - lower limit frequency density = FrequencyClass width Cumulative…
Q: The WISC-IV is a standardised instrument for measuring IQ in children. The population M = 100 and SD…
A: Given data: Mean : M =100 SD = 15 Child score (x) = 120 To find: The Z-score.
Q: m the oceans and the land but blocks some of the infrared heat that is e earth. This reflected heat…
A: *Answer:
Q: 15. [Calculator] Foot Lengths Listed below are foot lengths in inches of randomly selected Army…
A: Given: Sample size n = 11 Formula Used: Mean = ∑Xin Median = 2(n+1)4thterm Mode = the value which…
Q: Mood pressure: A blood pressure measurement consists of two numbers: the systolic pressure, w…
A: According to Given Data Systolic Diastolic 134 87 115 83 113 77 123 77 119 69 118 88…
Q: In this example with the help of the following details in the table of the 6 people having a…
A: Given that,
Q: In the follow ing table the Length af ye Laurel leaves ape recarded to the nearst millimetre.…
A: 1. The frequency for each class interval is obtained by counting the number of data values that lie…
Q: is a radionuclide used widely in nuclear medicine. 99m Tc is combined with another substance that is…
A:
Q: Source SS df MS Number of obs 935 %3D F(2, 932) Prob > F %3D 66.31 Model 19023273.1 9511636.56…
A: Given: Regression output
Q: 12) A partner has finished an experiment and submitted the following result for an analysis of…
A: Confidence interval
Q: Ambient temperatures (°C) of the sites where the extremophilic bacterium species Deinococcus…
A: Five number summary : It has five measures : maximum value First quartile Second quartile / median…
Q: 11, 5, 5, 5 Send data to calculator Suppose that these 4 measurements are respectively labeled x,…
A: 4 measurements are there 11,5,5,5. We need to find the sum of squares of the numbers.
Q: A part of the Life Table of a population is given hereunder with incomplete information. Find those…
A:
Q: S.N Temperature Humidity Yield 40 57 112 2 45 54 118 50 54 128 4 55 60 121 60 66 126 65 59 136 7 70…
A: Solution (d)
Q: 0.23 0.24 0.33 0.48 0.57 0.57 0.59 0.60 0.70 0.86 Use the accompanying radiation levels in for 50…
A: Given,sample size(n)=50The given data is already arranged in ascending order.
Q: How well materials conduct heat matters when designing houses, for example. Conductivity is measured…
A: (a). Draw a stem and leaf plot of the data: The data represents the measurements of the heat…
Q: Which of the following frequency does not give information about the status of a data class in the…
A: We have to find which of the following frequency does not give information about the status of a…

Step by step
Solved in 2 steps with 2 images

- The article “Withdrawal Strength of Threaded Nails” (D. Rammer, S. Winistorfer, and D. Bender, Journal of Structural Engineering 2001:442–449) describes an experiment comparing the ultimate withdrawal strengths (in N/mm) for several types of nails. For an annularly threaded nail with shank diameter 3.76 mm driven into spruce-pine-fir lumber, the ultimate withdrawal strength was modeled as lognormal with μ = 3.82 and σ = 0.219. For a helically threaded nail under the same conditions, the strength was modeled as lognormal with μ = 3.47 and σ = 0.272. a) What is the mean withdrawal strength for annularly threaded nails? b) What is the mean withdrawal strength for helically threaded nails? c) For which type of nail is it more probable that the withdrawal strength will be greater than 50 N/mm? d) What is the probability that a helically threaded nail will have a greater withdrawal strength than the median for annularly threaded nails? e) An experiment is performed in which withdrawal…Consider the accompanying data on flexural strength (MPa) for concrete beams of a certain type. 5.5 7.2 7.3 6.3 8.1 6.8 7.0 7.2 6.8 6.5 7.0 6.3 7.9 9.0 8.7 8.7 7.8 9.7 7.4 7.7 9.7 8.0 7.7 11.6 11.3 11.8 10.7 The data below give accompanying strength observations for cylinders. 6.6 5.8 7.8 7.1 7.2 9.2 6.6 8.3 7.0 8.4 7.3 8.1 7.4 8.5 8.9 9.8 9.7 14.1 12.6 11.3 Prior to obtaining data, denote the beam strengths by X1, . . . , Xm and the cylinder strengths by Y1, . . . , Yn. Suppose that the Xi's constitute a random sample from a distribution with mean μ1 and standard deviation σ1 and that the Yi's form a random sample (independent of the Xi's) from another distribution with mean μ2 and standard deviation σ2. Compute the estimated standard error. (Round your answer to three decimal places.) (c) Calculate a point estimate of the ratio σ1/σ2 of the two standard deviations. (Round your answer to three decimal places.) (d) Suppose a single beam and a single cylinder are…Six samples of each of four types of cereal grain grown in a certain region were analyzed to determine thiamin content, resulting in the following data (µg/g). Wheat 5.3 4.4 6.1 6.1 6.6 5.8 Barley 6.4 8.1 6.2 7.5 5.9 5.6 Maize 5.7 4.8 6.5 5.0 6.1 5.2 Oats 8.2 6.1 7.9 7.1 5.4 7.3 Does this data suggest that at least two of the grains differ with respect to true average thiamin content? Use a level ? = 0.05 test.State the appropriate hypotheses. H0: ?1 ≠ ?2 ≠ ?3 ≠ ?4 Ha: at least two ?i's are equal H0: ?1 = ?2 = ?3 = ?4 Ha: at least two ?i's are unequal H0: ?1 = ?2 = ?3 = ?4 Ha: all four ?i's are unequal H0: ?1 ≠ ?2 ≠ ?3 ≠ ?4 Ha: all four ?i's are equal Compute the test statistic value. (Round your answer to two decimal places.)f = What can be said about the P-value for the test? P-value > 0.100 0.050 < P-value < 0.100 0.010 < P-value < 0.050 0.001 < P-value < 0.010 P-value < 0.001 State the conclusion in the problem context. Reject H0.…
- Consider the accompanying data on flexural strength (MPa) for concrete beams of a certain type. 5.3 7.2 7.3 6.3 8.1 6.8 7.0 7.1 6.8 6.5 7.0 6.3 7.9 9.0 9.0 8.7 7.8 9.7 7.4 7.7 9.7 7.9 7.7 11.6 11.3 11.8 10.7 The data below give accompanying strength observations for cylinders. 6.8 5.8 7.8 7.1 7.2 9.2 6.6 8.3 7.0 9.0 7.6 8.1 7.4 8.5 8.9 9.8 9.7 14.1 12.6 11.8 Prior to obtaining data, denote the beam strengths by X1, . . . , Xm and the cylinder strengths by Y1, . . . , Yn. Suppose that the Xi's constitute a random sample from a distribution with mean ?1 and standard deviation ?1 and that the Yi's form a random sample (independent of the Xi's) from another distribution with mean ?2 and standard deviation ?2. (a) Calculate the estimate for the given data. (Round your answer to three decimal places.) (b) Use rules of variance to obtain an expression for the variance and standard deviation (standard error) of the estimator in part (a). V(X − Y) = V(X) + V(Y) =…A recent poll found that 664 out of 1026 randomly selected people in a particular country felt that colleges and universities with big sports programs placed too much emphasis on athletics over academics. Assuming the conditions for the CLT are met, use the accompanying Minitab output to complete parts a and b below. N Event Sample p 95% CI for p 1026 664 0.647173 (0.617934, 0.676413) Question content area bottom b. Suppose a sports blogger wrote an article claiming that a majority of adults from this country believe that colleges and universities with big sports programs place too much emphasis on athletics over academics. Does this confidence interval support the blogger's claim? Explain your reasoning. A. No, it is not a plausible claim because the confidence interval contains 50%. B. No, it is not a plausible claim because the confidence interval does not contain only values above 50%. C. Yes, it is a…Researchers interested in lead exposure due to car exhaust sampled the blood of 52 police officers subjected to constant inhalation of automobile exhaust fumes while working traffic enforcement in a primarily urban environment. The blood samples of these officers had an average lead concentration of 124.32 µg/l and a SD of 37.74 µg/l; a previous study of individuals from a nearby suburb, with no history of exposure, found an average blood level concentration of 35 µg/l. Test the hypothesis that the downtown police officers have a higher lead exposure than the group in the previous study. Interpret your results in context. Based on your preceding result, without performing a calculation, would a 99% confidence interval for the average blood concentration level of police officers contain 35 µg/l? Based on your preceding result, without performing a calculation, would a 99% confidence interval for this difference contain 0? Explain why or why not.
- Suppose that we want to compare the cholestrol contents of four competing diet foods on the basis of the following data (in milligrams per package) which were obtained for three 6-ounce packages of each of the diet foods: Diet food A: 3.6 4.1 4.0 Diet food B: 3.1 3.2 3.9 Diet food C: 3.2 3.5 3.5 Diet food D: 3.5 3.8 3.8 Fill in the blanks below. Test at the 0.05 level of significance whether the differences among means obtained for the four competing diet foods (Diet A, B, C, D) are significant? (Ftable=4.07) source of varation degrees of freedom sum of squares mean squares F treatments ? 0.54 ? ? error ? ? ? total ? 1.18Suppose that we want to compare the cholestrol contents of four competing diet foods on the basis of the following data (in milligrams per package) which were obtained for three 6-ounce packages of each of the diet foods: Diet food A: 3.6 4.1 4.0 Diet food B: 3.1 3.2 3.9 Diet food C: 3.2 3.5 3.5 Diet food D: 3.5 3.8 3.8 a)Fill in the blanks below. b)Test at the 0.05 level of significance whether the differences among means obtained for the four competing diet foods (Diet A, B, C, D) are significant? (Ftable=4.07) ONE-WAY ANOVA TABLE Source of Variation Degrees of Freedom Sum of Squares Mean Square F Treatments ? 0.54 ? ? Error ? ? ? Total ? 1.18The data table shows the yields for a one-year certificate of deposit (CD) and a five-year CD for 13 banks. Complete parts (a) through (c). One-Year CD Five-Year CD 2.47 3.24 3.47 4.78 2.88 4.61 3.64 4.98 2.81 2.75 3.65 3.87 2.86 2.87 3.75 3.69 2.79 2.67 4.14 3.51 4.24 4.76 4.94 4.89 3.31 3.72 a. Compute the first quartile (Q1), the third quartile (Q3), and the interquartile range for a one-year CD.
- The data given is shown below 40 40 43 46 44 49 51 54 46 51 47 49 49 45 45 44 45 41 49 52 51 54 50 51 41 52 53 50 46 56 42 42 40 42 49 47 51 48 46 57 48 55 49 46 57 44 49 43 44 43 51 48 48 46 49 Class width = 6 Find the following: A. Decile (5th) B. Quartile (2nd) C. Skewness D. KurtosisThe British Department of Transportation studied to see if people avoid driving on Friday the 13th. They did a traffic count on a Friday and then again on a Friday the 13th at the same two locations. The data for each location on the two different dates is in the table. Do the data show that on average fewer people drive on Friday the 13th? Test at the 5% level.Traffic Count Dates 6th 13th 1990, July 137669 135825 1990, July 129699 128891 1991, September 136898 138275 1991, September 138966 139940 1991, December 132021 129640 1991, December 119268 119214 1992, March 131938 131104 1992, March 123306 124760 1992, November 129499 129219 1992, November 138568 135934In an experiment to determine the effect of ambient temperature on the emissons of oxides of nitrogen ( NOx ) of diesel trucks, 10 trucks were run at temperatures of 40°F and 80°F . The emissions, in parts per billion, are presented in the following table. Truck 40°F 80°F 1 926.5 896.7 2 851.1 857.0 3 975.5 952.1 4 1009.3 884.8 5 871.8 840.7 6 949.2 885.1 7 1006.3 885.5 8 836.5 777.8 9 837.8 850.2 10 958.9 882.1 Send data to Excel Let μ1 represent the mean emission at 40°F and =μd−μ1μ2 .Can you conclude that the mean emission differs between the two temperatures? Use the =α0.05 level of significance and the TI-84 Plus calculator to answer the following. p value ? do we reject? is there enough evidence :?