
MATLAB: An Introduction with Applications
6th Edition
ISBN: 9781119256830
Author: Amos Gilat
Publisher: John Wiley & Sons Inc
expand_more
expand_more
format_list_bulleted
Related questions
Question
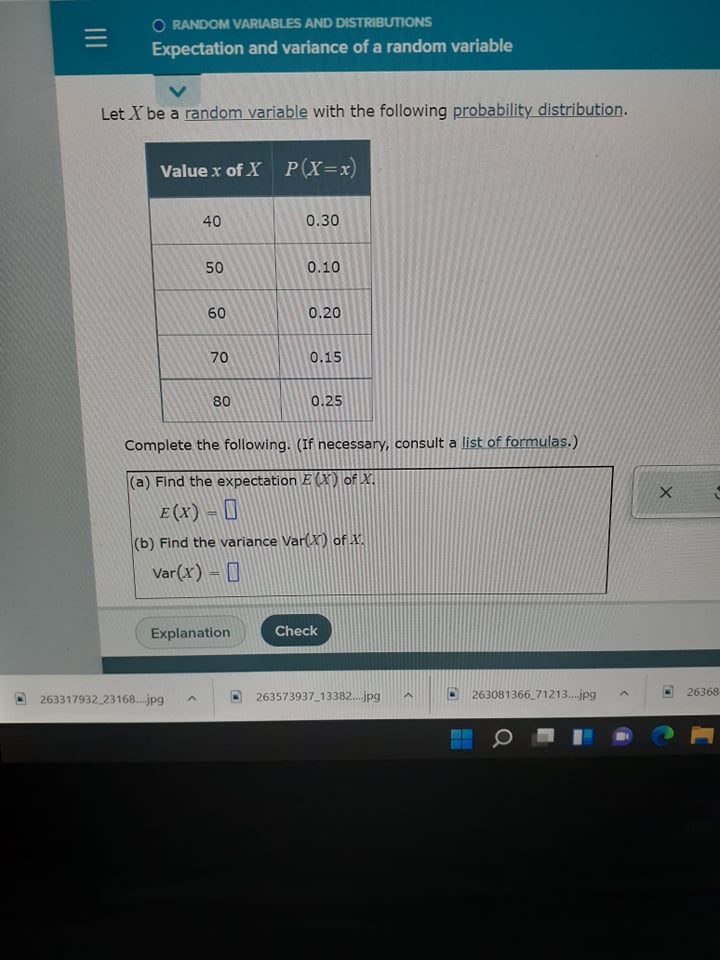

Transcribed Image Text:O RANDOM VARIABLES AND DISTRIBUTIONS
Expectation and variance of a random variable
Let X be a random variable with the following probability distribution.
Value x of X P(X=x)
40
0.30
50
0.10
60
0.20
70
0.15
80
0.25
Complete the following. (If necessary, consult a list of formulas.)
(a) Find the expectation E (X) of X.
E(x) -0
(b) Find the variance Var(X) of X.
Var(x) = I
%3D
Explanation
Check
263317932 23168...jpg
263573937_13382.jpg
263081366_71213.jpg
26368
Expert Solution
This question has been solved!
Explore an expertly crafted, step-by-step solution for a thorough understanding of key concepts.

Step by stepSolved in 2 steps with 2 images

Knowledge Booster

Similar questions
- Let X be a random variable with the following probability distribution. Value x of X P(X=x) 10 20 30 40 50 0.10 0.30 0.20 0.25 0.15 Complete the following. (If necessary, consult a list of formulas.) (a) Find the expectation E (X) of X. E (X) = 0 (b) Find the variance Var(X) of X. Var(x) =arrow_forwardComplete parts (a) and (b) below. The number of dogs per household in a small town x P(x)0 0.6671 0.2052 0.0833 0.0244 0.0145 0.006 (a) Find the mean, variance, and standard deviation of the probability distribution. Find the mean of the probability distribution. (b) Use the found values of the mean and the standard deviation to interpret the results in the context of the real-life situation.arrow_forwardExercise(3): If the mean and variance of a binomial distribution are 9 and 6 respectively, then find: (1) The probability mass function P(x = k) (2) P(x=3) (3) P(x>1)arrow_forward
- Random Variable X Directions: Compute the expected value, variance, and standard deviation for random variable X whose probability table is given below: Possible Outcome 8 10 12 14 0.1 0.4 0.4 0.1 Probability Probability Table for X 1. The Expected Value of X is E(X) 2. The Variance of X is Var(X) 3. The Standard Deviation of X is Std(X) Random Variable Y Directions: Compute the expected value, variance, and standard deviation for random variable Y whose probability table is given below: Possible Outcome 8 10 12 14 Probability 0.3 0.2 0.2 0.3 Probability Table for Y 1. The Expected Value of Y is E(Y) 2. The Variance of Y is Var(Y) 3. The Standard Deviation of Y is Std(Y)arrow_forwardGiven the random variable X and its probability density function below, find the mean, variance, and standard deviation of X. X Pr(X) 0 0.3 3 0.7 Mean = Variance = Standard Deviation =arrow_forwardFind the probability that X=2. Find the expected value.arrow_forward
- Directions: Compute the expected value, variance, and standard deviation for random variable X whose probability table is given below: Possible Outcome -1 0 1/7 1/7 Probability Probability Table for X 1. The Expected Value of X is E(X) 2. The Variance of X is Var(X) 3. The Standard Deviation of X is Std(X) 1 2 5/14 5/14arrow_forwardP(x) 0.091 A sociologist randomly selects single adults for different groups of three, and the random variable x is the number in the group who say that the most fun way to flirt is in person. Determine whether a probability distribution is given. If a probability distribution is given, find its mean and standard deviation. If a probability distribution is not given, identify the requirements that are not satisfied. 0.332 0.418 3 0.159 ..... Does the table show a probability distribution? Select all that apply. O A. Yes, the table shows a probability distribution. B. No, the sum of all the probabilities is not equal to 1. C. No, the random variable x is categorical instead of numerical. O D. No, not every probability is between 0 and 1 inclusive. E. No, the random variable x's number values are not associated with probabilities. Find the mean of the random variable x. Select the correct choice below and, if necessary, fill in the answer box to complete your choice. O A. µ= adult(s)…arrow_forward
arrow_back_ios
arrow_forward_ios
Recommended textbooks for you
- MATLAB: An Introduction with ApplicationsStatisticsISBN:9781119256830Author:Amos GilatPublisher:John Wiley & Sons Inc
 Probability and Statistics for Engineering and th...StatisticsISBN:9781305251809Author:Jay L. DevorePublisher:Cengage Learning
 Statistics for The Behavioral Sciences (MindTap C...StatisticsISBN:9781305504912Author:Frederick J Gravetter, Larry B. WallnauPublisher:Cengage Learning
  Elementary Statistics: Picturing the World (7th E...StatisticsISBN:9780134683416Author:Ron Larson, Betsy FarberPublisher:PEARSON
 The Basic Practice of StatisticsStatisticsISBN:9781319042578Author:David S. Moore, William I. Notz, Michael A. FlignerPublisher:W. H. Freeman
 Introduction to the Practice of StatisticsStatisticsISBN:9781319013387Author:David S. Moore, George P. McCabe, Bruce A. CraigPublisher:W. H. Freeman
MATLAB: An Introduction with Applications
Statistics
ISBN:9781119256830
Author:Amos Gilat
Publisher:John Wiley & Sons Inc
Probability and Statistics for Engineering and th...
Statistics
ISBN:9781305251809
Author:Jay L. Devore
Publisher:Cengage Learning
Statistics for The Behavioral Sciences (MindTap C...
Statistics
ISBN:9781305504912
Author:Frederick J Gravetter, Larry B. Wallnau
Publisher:Cengage Learning
Elementary Statistics: Picturing the World (7th E...
Statistics
ISBN:9780134683416
Author:Ron Larson, Betsy Farber
Publisher:PEARSON
The Basic Practice of Statistics
Statistics
ISBN:9781319042578
Author:David S. Moore, William I. Notz, Michael A. Fligner
Publisher:W. H. Freeman
Introduction to the Practice of Statistics
Statistics
ISBN:9781319013387
Author:David S. Moore, George P. McCabe, Bruce A. Craig
Publisher:W. H. Freeman