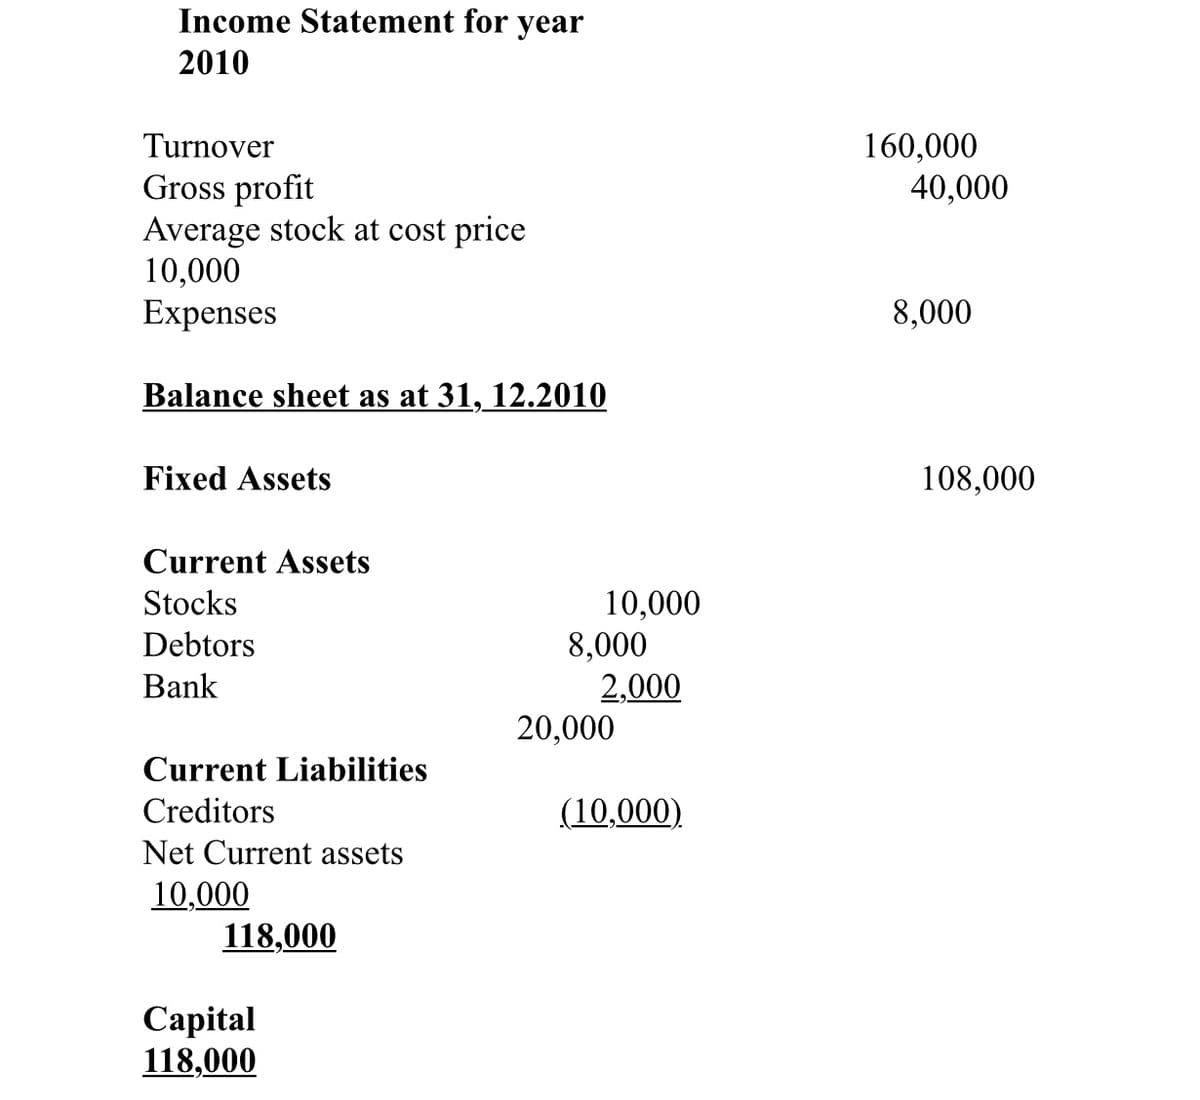
find: 1. gross profit margin 2. stock turn over 3. net profit margin


Q: Return on capital employed J Current ratio K Liquid ratio
A: Hi There, thanks for posting the question. But as per Q&A guidelines, we must answer the first…
Q: a) Calculate the return on assets. (Enter your answer as a percent rounded to 2 decimal places.) b)…
A: Return on Assets is one of the method for determining the profitability of a company. This ratio…
Q: Complete the spreadsheet by calculating Gross Profit; Gross Profit Margin; ROE; D/E; Current Ratio;…
A: Note: Since we only answer up to 3 sub-parts, we’ll answer the first 3. Please resubmit the question…
Q: RATIO ANALYSIS Liquidity Ratio Current Ratio Solvency Ratio Debt to Equity Ratio Debt to Assets…
A: Financial Ratios are a method of analyzing the financial performances of the business and provide…
Q: formula for the following: 1. price earnings ratio 2. dividend yield ratio 3. dividend payout ratio…
A: Note: Since you have posted a question with multiple sub-parts, we will solve the first three…
Q: Assume you are given the following relationships for the Clayton Corporation: Sales/total assets…
A: Given the following information: Sales/total assets: 1.5 Return on assets (ROA): 3% Return on…
Q: Calculate Ebanks, Inc.'s margin and net income. h. Çalculate Ebanks, Inc.'s return on а. equity.
A: Step 1 Calculation of net income: Calculation of Margin:
Q: Dividends paid per common share divided by the market price per common share produces the: Select…
A: Dividends are a part of net income that are paid to the shareholder of the company in the form of…
Q: Interpretation and verbal analysis compared to industry ratios: 1. Liquidity 2. Profitability 3.…
A: Liquidity ratio measures an entity's ability to pay off its short-term or current liabilities and…
Q: Return on equity…… Select one: a. is calculated by dividing net income plus preferred dividends by…
A: Introduction: Preferred shares: Preferred share holders receive preferred dividend before…
Q: Common measures of a company's profitability include price-earnings ratio earnings per share…
A: The profitability ratios are used to measure the business's ability for generating profit from its…
Q: QUESTION 10 A company has a Return on Equity of 0.36, a Profit Margin of 0.15 and Total Asset…
A: The Return on Equity as per Du Pont Model will be calculated. The return on equity using the DuPont…
Q: 3. A common-size income statement for Palomer would report (amounts rounded) a. Net income of 19% b.…
A: The analysis of financial statements helps to measure the result of two years with comparison of…
Q: Calculate the following ratios: 1. Return on Capital Employed (ROCE) 2. Current Ratio 3. Gearing…
A: 1.Return on Capital Employed (ROCE) Return on capital employed is calculated by dividing net…
Q: Calculate: 1.Total Market Value for the firm 2.After tax cost of debt 3.Cost of equity 4.Cost of…
A: “Since you have posted a question with multiple sub-parts, we will solve the first three sub-parts…
Q: 11, Dudley Bank has the following balance sheet and income statement. Calculate: Equity multiplier…
A: Introduction :- Following is provided the balance sheet and the Income Statement of co. From which…
Q: The company’s ratios are: Current ratio = 1.58% Quick ratio = 1.53% operating margin = 3.49%…
A: Bank loan is a type of debt that can be taken by the firm to raise additional capital. In other…
Q: 6.. ratios measure the ability of a firm to earn an adequate eturn on sales, O A) Asset utilization…
A: The ratios which measures the ability of an organization to generate adequate earnings are relative…
Q: ompute for the price-earnings ratio if the earnings per share are Php 5.50: Market Value per…
A: Price Earnings Ratio = Market Value Per Share/ Earnings Per Share
Q: Directions: Identify the variables if it can be regarded as a response variable and if it can be…
A: The experiment's response variable is the outcome. It is a variable whose variation is explained by…
Q: Comparison: 1. Observe the trend of revenues for both companies. Which company has higher revenue?…
A: The question is related to analysis of Financial Statements of two companies from 2007 to 2010 based…
Q: Return on sales RoA-Operational RoA-Total Management Performance
A: Accounting Ratios are the tools used to interpret the financial statements of a corporation in an…
Q: a. Calculate Keystone's return on stockholders' equity. Round your answer to two decimal places. %…
A: Financial statements are prepared at the year-end so that position and performance of a company can…
Q: ompute the following: 1. Horizontal and Vertical Analysis 2. Liquidity Ratios 3. Profitability Ratio
A: Note: Hi! Thank you for the question As per the honor code, We’ll answer the first question since…
Q: Compute the following financial ratios using the given financial statements below. Round off your…
A: Net profit ratio is the ratio which states and measures as well as shows how much company has net…
Q: Gross Profit Ratio for a firm remains same but the Net Profit Ratio is decreasing. The reason for…
A: Gross profit is given by sales revenue minus cost of goods sold. Gross profit =Sales revenue- cost…
Q: Define profitability raitos return on assets and return on equity. According to the following…
A: Return on assets (ROA) is computed by dividing net income by total assets: Return on equity (ROE)…
Q: Directions: Read each sentence carefully and detemine whether the statement is TRUE or FALSE. Wite…
A: Ratio analysis means where different ratio of various years of companies has been compared and…
Q: Match the following ratio functions with the ratio (place the number of your chosen answer into the…
A: Ratio analysis: It refers to the quantitative technique of financial analysis that allows gaining an…
Q: multiplier is 1.64. Using DuPont analysis, determine if the company's return on equity is above or…
A: DuPont Analysis: DuPont Analysis helps to understand the three components of Return on Equity which…
Q: A company has an EPS of $2.00, a cash flow per share of $3.00, and a price/cash flow ratio of 8.0#.…
A: The financial ratios refer to the ratios that are calculated using the financial data from the…
Q: A. Compute the following: 1. Horizontal and Vertical Analysis 2. Liquidity Ratios 3. Profitability…
A: Note: Hi! Thank you for the question, As per the honor code, we are allowed to answer three…
Q: Indicate whether the following are a measure of (a) liquidity, (b) profitability, or (c) leverage.…
A:
Q: he ratio percentage of earnings retained is the same as that termed : A- dividend yield B-…
A: Dividend yield means the ratio of dividend to market price per share. Dividend payout means ratio of…
Q: True
A: Common stock refers to the shares in a company that is owned by the general public and has several…
Q: BASELINE ACTIVITY 1 Classify the given financial indicators in the table below (see the example…
A: Profitability ratios are the ratios that indicate the ability of the company to generate profit by…
Q: Profitability ratios: 1. 2. 3. 4. 5. 6. Return on equity Return on assets Gross profit percentage…
A: Ratio analysis is a technique of analysis and interpretation of financial statements. It is the…
Q: A company has a Return on Equity of 0.2, a Profit Margin of 0.12 and Total Asset Turnover of 0.48.…
A: Return on Equity can be calculated using the DuPont formula. It breaks the calculation using three…
Q: A company has a Returm on Equity of 0.39, a Profit Margin of 0.2 and Total Asset Turnover of 0.55.…
A: Here, Return on Equity is 0.39 Profit Margin is 0.2 Total Asset Turnover is 0.55
Q: Profitability ratios include the profit margin on sales, the return on total assets, and the return…
A: Profitability ratios are a class of financial metrics that are used to assess a business's ability…
find:
1. gross profit margin
2. stock turn over
3. net profit margin
4. return on capital employment
5.
6. quick ratio

Step by step
Solved in 2 steps


- Twenty metrics of liquidity, solvency, and profitability The comparative financial statements of Automotive Solutions Inc. are as follows. The market price of Automotive Solutions Inc. common stock was $119.70 on December 31, 20Y8 Instructions Return on common stockholders’ equityTwenty metrics of liquidity, solvency, and profitability The comparative financial statements of Automotive Solutions Inc. are as follows. The market price of Automotive Solutions Inc. common stock was $119.70 on December 31, 20Y8 Instructions Return on stockholders’ equityTwenty metrics of liquidity, solvency, and profitability The comparative financial statements of Automotive Solutions Inc. are as follows. The market price of Automotive Solutions Inc. common stock was $119.70 on December 31, 20Y8 Instructions Earnings per share on common stock
- Twenty metrics of liquidity, solvency, and profitability The comparative financial statements of Automotive Solutions Inc. are as follows. The market price of Automotive Solutions Inc. common stock was $119.70 on December 31, 20Y8 Instructions Ratio of liabilities to stockholder.' equityTwenty metrics of liquidity, solvency, and profitability The comparative financial statements of Automotive Solutions Inc. are as follows. The market price of Automotive Solutions Inc. common stock was $119.70 on December 31, 20Y8 Instructions Dividends per share of common stockTwenty metrics of liquidity, solvency, and profitability The comparative financial statements of Automotive Solutions Inc. are as follows. The market price of Automotive Solutions Inc. common stock was $119.70 on December 31, 20Y8 Instuctins Times preferred earned
- Twenty metrics of liquidity, solvency, and profitability The comparative financial statements of Automotive Solutions Inc. are as follows. The market price of Automotive Solutions Inc. common stock was $119.70 on December 31, 20Y8 Instructions Return on total assetsTwenty metrics of liquidity, solvency, and profitability The comparative financial statements of Automotive Solutions Inc. are as follows. The market price of Automotive Solutions Inc. common stock was $119.70 on December 31, 20Y8 Instructions Ratio of fixed assets to long-term liabilitiesSome selected financial statement items belonging to MNO Company are given in the table below. According to this information, which of the following is Return on Assets (ROA) in 2021? Inventory 12,500Total Assets in 2021 110,000Current Liabilities 40,000Total Assets in 2020 90,000Net Profit 12,000Shareholders' Equity 65,000 Select one:a. 0.12b. 0.10c. 0.18d. 0.13
- Swifty Corporation’s comparative balance sheets are presented below. SWIFTY CORPORATIONBalance SheetsDecember 3120222021Cash$12,500 $6,100 Accounts receivable18,400 26,600 Inventory13,200 10,200 Land34,200 30,200 Building76,200 76,200 Accumulated depreciation(17,200) (14,200)Total137,300 135,100 Accounts payable19,500 33,300 Common stock ($5 par)74,500 74,500 Retained earnings43,300 27,300 Total137,300 135,100 Swifty’s 2022 income statement included net sales of $122,000, cost of goods sold of $82,000, and net income of $31,000. Compute the following ratios for 2022. (Round Debt to total assets ratio to 1 decimal place, e.g 1.8 and all percentage and days answers to 0 decimal places, e.g 18 or 25% and all other answers to 2 decimal places, e.g. 1.83) (a)Current ratioenter the ratio rounded to 2 decimal places (b)Acid-test ratioenter the ratio rounded to 2 decimal places…Swifty Corporation’s comparative balance sheets are presented below. SWIFTY CORPORATIONBalance SheetsDecember 3120222021Cash$12,500 $6,100 Accounts receivable18,400 26,600 Inventory13,200 10,200 Land34,200 30,200 Building76,200 76,200 Accumulated depreciation(17,200) (14,200)Total137,300 135,100 Accounts payable19,500 33,300 Common stock ($5 par)74,500 74,500 Retained earnings43,300 27,300 Total137,300 135,100 Swifty’s 2022 income statement included net sales of $122,000, cost of goods sold of $82,000, and net income of $31,000. Compute the following ratios for 2022. (Round Debt to total assets ratio to 1 decimal place, e.g 1.8 and all percentage and days answers to 0 decimal places, e.g 18 or 25% and all other answers to 2 decimal places, e.g. 1.83) Inventory turnoverenter the number rounded to 2 decimal places Days in inventoryenter the number of days rounded to 0 decimal…Swifty Corporation’s comparative balance sheets are presented below. SWIFTY CORPORATIONBalance SheetsDecember 3120222021Cash$12,500 $6,100 Accounts receivable18,400 26,600 Inventory13,200 10,200 Land34,200 30,200 Building76,200 76,200 Accumulated depreciation(17,200) (14,200)Total137,300 135,100 Accounts payable19,500 33,300 Common stock ($5 par)74,500 74,500 Retained earnings43,300 27,300 Total137,300 135,100 Swifty’s 2022 income statement included net sales of $122,000, cost of goods sold of $82,000, and net income of $31,000. Compute the following ratios for 2022. (Round Debt to total assets ratio to 1 decimal place, e.g 1.8 and all percentage and days answers to 0 decimal places, e.g 18 or 25% and all other answers to 2 decimal places, e.g. 1.83)
