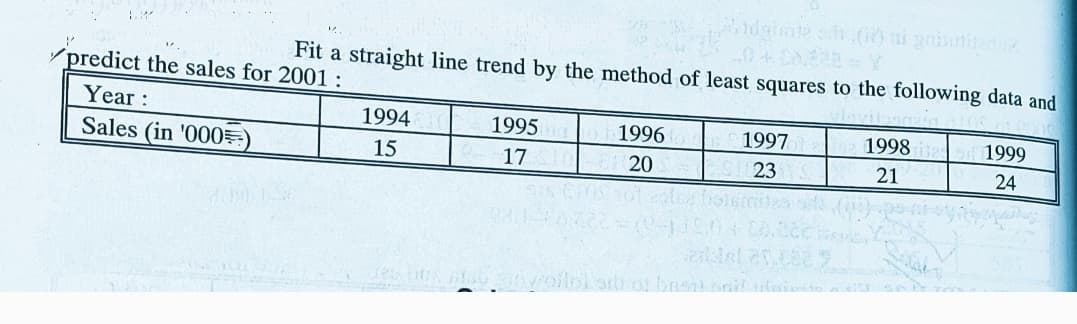
Fit a straight line trend by the method of least squares to the following data and ´predict the sales for 2001 : Year: 1994 1995 1996 1998 1999 1997 Sales (in '000=) 15 17 20 23 21 24


Q: 11. Calculate the trend values by the method of least squares from the data given below and estimate…
A:
Q: U.S. Census Bureau estimates of the average number of persons per household in the United States for…
A: “Since you have posted a question with multiple sub-parts, we will solve first three sub-parts for…
Q: An engineer found that by including small amounts of a compound in rechargeable batteries for…
A:
Q: A sales manager collected the following data on annual sales for new customer accounts and the…
A: Given data, Year of experience Annual sales 1 80 2 89 3 94 3 90 5 104 6 101 7 110…
Q: Table gives life expectancies for people born in the United States in the given years.…
A: The given shows that the life expectancy for people born in U.S. in respective years.
Q: The number of adults (in millions) using e-book devices is expected to climb in the years ahead. The…
A:
Q: 10. Fit a straight line trend to the data given below by the method of least squares. Year: 1989…
A:
Q: From the data given below fit a straight line trend by the method of least squares : Years 1975 1976…
A:
Q: 2) Fit a straight line to the data shown below using least squares met
A: Given, x 2 3 4 5 6 y 3 6 7 12 14
Q: Below given are the figures of production (in thousand tonnes) of coal mine : Year 2002 2004 : 2005…
A:
Q: Fit a straight line by the method of least squares to the data given below : Year 2010 2011 2012…
A: The given straight line to fit the sales (i.e., the variable Y ) based on a given year (i.e,…
Q: 52. For the following table : O Fit a straight line trend by the method of least squares. (1)…
A:
Q: 23 Fit a straight line by the method of least squares to the data given below: Year 1980 1981 1982…
A:
Q: A real estate agent wants to predict the selling price of single-family homes from the size of each…
A: The given least square regression line is as follows: Here, price in thousands of dollars and size…
Q: The table below shows the life expectancy for an individual born in the United States in certain…
A: Given Data : Year of Birth = X Life Expectancy = Y 1930 59.7 1940 62.9 1950 70.2 1965…
Q: A test of an internet service provider showed the following download times (in seconds) for files of…
A:
Q: 51. Below are given the annual production figures (in thousand tonnes) of a fertiliser factory: Year…
A:
Q: Fit a straight line equation by the method of least square for the following imaginary data relating…
A:
Q: You are given the population figures of India as follows: Census year (X) 1951 1961 1971 1981 1991…
A: Solution:
Q: Fit the straight line trend to the following figures by the method of least squares : Year : 1975…
A: Data Let Years=X , Y=sales in 000 tonnes
Q: The CDC released the following table of life expectancies for Americans from 1900-2010. Year 1900…
A: Let us consider, Y as life expectancy and X as year. Excel Procedure: Enter Y and lnX in…
Q: Fit a straight line trend by the method of least squares to the following data : Yea Production of…
A: By secular trend mean smooth secular trend observes over a long period of time. Smoothing…
Q: 7. From the data given below, fit a straight line trend by the method of least squares : Years 1975…
A:
Q: Fit a straight line by the method of least squares for the data relating to the Indian population…
A: The straight line form is Y = mx + c . This straight line equation can be used for forecasting (or)…
Q: A sociologist is interested in the relation between x = number of job changes and y = annual salary…
A:
Q: . Given below are the figures of production (in thousand mounds) of a Sugar factory: Year 2001 2002…
A: Regression Equation: When we want to predict the value of one variable, say Y, from the given value…
Q: An engineer found that by including small amounts of a compound in rechargeable batteries for…
A: a) In this case the variable “Life (hours)” (y) is the dependent variable and the “Amount of…
Q: The following data represent a company’s yearly sales volume and its advertising expenditure over a…
A: Part 1: The scatter diagram of sales versus advertising and is as given below: The above scatter…
Q: Consider the following table of data. 1 2 4 9. y 1 2 4 -20 (a) Calculate the least squares line and…
A: Given values for x and y. We need to find the least square line.
Q: The following data represent the speed at which a ball was hit (in miles per hour) and the distance…
A: Given that Using excel regression
Q: The following represents the number of birthday gifts received at different ages. x, age in years y,…
A: Thanks for the question :)And your upvote will be really appreciable ;)
Q: Based on the following data - (a) units produced from September to December are as follows: 18,900,…
A: The following data is given: Unit produced (X) Cost (Y) 18,900 240,800 17,500 198,000…
Q: 162 Calculate the trend values by the method of least squares from the data given below and estimate…
A:
Q: :1. Fit a straight line trend for the following data by Least Square method. Also find production…
A: Given that X= Years , Y=Production of steel (in tonnes) X Y 2009 12 2010 20 2011 28…
Q: The average remaining lifetimes for women of various ages in a certain country are given in the…
A: a) Excel Procedure: Enter X and Y data in Excel>Go to Data>Click on Data Analysis>…
Q: 58. Fit a straight line trend by least squares method and tabulate the trend values trom the…
A:
Q: Compute the least-squares regression equation for the given data set. Use a TI-84 calculator. Round…
A: The independent variable is x. The dependent variable is y. We have to compute the least squares…
Q: 12. Fit a straight line trend by the method of least squares to the following data. Assuming that…
A:
Q: 2. Table below records the quarterly refrigerator sales for the period 2012-2014. Number of 2 3…
A: Year quarter 1 quarter 2 quarter 3 quarter 4 2012 46 41 60 63 2013 56 52 66 72 2014 58 56 75…
Q: The following table gives the amount spent on cellular service. Cellular service revenue Date (in…
A: The Regression line can be represented by , y =mx +a…
Q: The following data represent a company’s yearly sales volume and its advertising expenditure over a…
A: 1. In this case Advertising (x) the independent variable and Sales (y) is the dependent variable.…
Q: Find the least squares line
A:
Q: Calculate the trend values by the method of least squares from the data given below and estimate the…
A:
Q: 7. Fit a straight line trend by the method of least squares to the following data. Year: 1989 1990…
A:
Q: (b) How much of the variation in average annual energy expenditures is explained by the…
A:
Q: Fit a straight line trend by the method of least squares to the following data. Assuming that the…
A: The least square regression line is the straight line which relate the dependent variable y with…
Q: The following table is an abbreviated life expectancy table for males. current age, x 0 20 40 60…
A: The life expectancy table is given as Current age(x)020406080life…

Step by step
Solved in 3 steps with 3 images

- Compute the sum-of-squares error (SSE) by hand for the given set of data and linear model. (8, 10), (9, 11), (16, 20), (12, 2); y = 2x − 8The following table shows the percent of water and the number of calories in various canned soups to which 100 g of water are added. (show all the necessary solution) Percent Water in Soups % Water Calories 83.3 28 92.3 26 91.9 39 89.4 57 89.5 57 90.5 36 91.9 32 91.7 32 a. Find the equation of the least squares line for the data. b. Use the equation in part a to find the expected number of calories in a soup that is 87% water. c. Determine the correlation coefficient of the data.The article “Characterization of Highway Runoff in Austin, Texas, Area” (J. of Envir. Engr., 1998: 131–137) gave a scatterplot, along with the least squares line, of x = rainfall volume (m3) and y = runoff volume (m3) for a particular location. The accompanying values were read from the plot. x <‐ c(5, 12, 14, 17, 23, 30, 40, 47, 55, 67, 72, 81, 96, 112, 127) y <‐ c(4, 10, 13, 15, 15, 25, 27, 46, 38, 46, 53, 70, 82, 99, 100) Test at level 0.05 whether there is a useful linear relationship between rainfall and runoff,and then calculate a 95% confidence interval for the true average change in runoff volumeassociated with one unit (one m3) increase in rainfall volume.
- J 2 make a 2 way ANOVA table for data on MATLAB with codeA machine filling 18-gram containers of a hair dye is set so that the average fill is18.2 grams with a variance of 0.49 grams. Assume that the filling of containers bythis machine is normally distributed.(a) What percentage of the containers is not likely to meet the producer’sspecification of at least 18 grams per container?(b) What is the minimum mass of the heaviest 15% of containers?The shape of the mean-variance frontier that results from the combination of a riskless and arisky asset is…..:a. Is U-shaped, tilted 90 degrees clockwise.b. Is a straight line passing from the mean-variance points of the two assets.c. Is a hyperbola.d. Consists of two straight lines, each connecting one of the two assets to a risk-freeportfolio
- A local group of economists wants to study the effects of the pandemic on the small businesses in their city. A survey was sent out to a random sample of small businesses to anonymously report both their weekly earnings in $1000 for January 2020 (group 1) and January 2021 (group 2). Assume that the weekly earnings are normally distributed. Only 10 businesses provided enough data to compute their average weekly earnings for two months. The groups are dependent. Use α = 0.01 to decide whether there is sufficient evidence that the pandemic reduced the average weekly earnings for small businesses. January 2020 January 2021 58.2 60.5 78.3 62.5 38.2 40.9 32.7 36.2 43.8 36.2 33.7 30.9 50.5 41.4 56.3 38.3 41.1 37.9 26.4 21.7 1. What are the correct hypotheses? H0: H1: 2. Based on the hypotheses, compute the following: Round answers to at least 4 decimal places. The test statistic is = The critical value is =…A local group of economists wants to study the effects of the pandemic on the small businesses in their city. A survey was sent out to a random sample of small businesses to anonymously report both their weekly earnings in $1000 for January 2020 (group 1) and January 2021 (group 2). Assume that the weekly earnings are normally distributed. Only 10 businesses provided enough data to compute their average weekly earnings for two months. The groups are dependent. Use α = 0.01 to decide whether there is sufficient evidence that the pandemic reduced the average weekly earnings for small businesses. January 2020 January 2021 58.5 29.7 37.1 50.8 48.4 36.8 44.8 33.9 72.9 36.5 27.9 45.6 78.5 58.4 53.4 51.2 83.4 47 48.2 33.6 1) What are the correct hypotheses? H0: H1: 2) Based on the hypotheses, compute the following: Round answers to at least 4 decimal places. The test statistic is = The critical value is =…Design a 3rd order Least-squares function approximation to interpolate between the mid between (2n and 3") for a dataset as chosen by you. Compute the LS model error.
- Calculate Pearson’s coefficient of skewness. Hence, describe the shape of thedistribution of the waiting time for counter A and B.The salaries of physicians in a certain speciality are approximately normally distributed. 25% of these physicians earn less than $180,000 and 25% earn more than $320,000. Let X be the salary (per thousand) of a randomly chosen physician in this specialty, find the mean and variance of X.Is a baseball players' slugging percentage correlated to their strikeout percentage? A random sample of n=6n=6professional baseball players gave the following data (Source: baseball-reference.com) Slugging 0.396 0.42 0.323 0.078 0.473 0.467 Strikeouts 27 14.3 30.8 47.1 17.8 36.7 Find the least squares line if we consider slugging percengtage as the explanatory variable and strikeout percentage as the response variable. (Round the y-intercept and slope to 2 decimal places.)y^ = For a unit increase in slugging percentage, how much of a decrease Correct in strikeout percentage is predicted? (Round your answer to 2 decimal places.) What percentage of the variation in strikeout percentage (yy) can be explained by slugging percentage (xx) and the least squares line? (Round to the nearest percent.) p-value (Round to four decimal places)
