
MATLAB: An Introduction with Applications
6th Edition
ISBN: 9781119256830
Author: Amos Gilat
Publisher: John Wiley & Sons Inc
expand_more
expand_more
format_list_bulleted
Related questions
Question
Could you solve the questions with R, please? (Only R please)
Use acf()
I took a screenshot of the data. ( please write the codes based on the screenshot data)
There are a total of 409 rows in the data.
When you write the R codes, could you also include explanations as well?
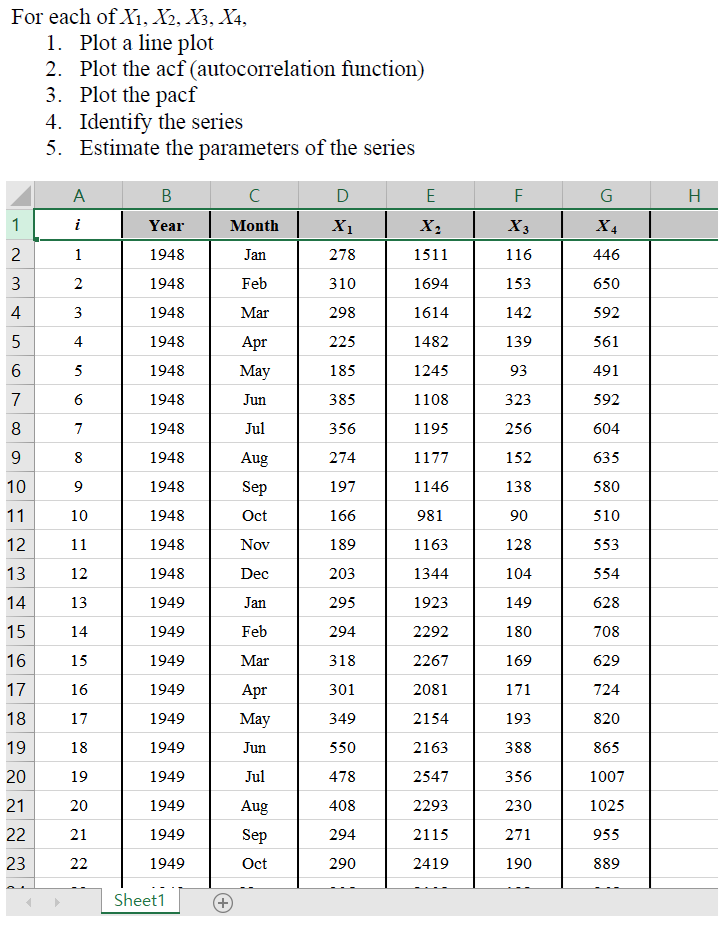

Transcribed Image Text:For each of X₁, X2, X3, X4,
1. Plot a line plot
2. Plot the acf (autocorrelation function)
3. Plot the pacf
4. Identify the series
5. Estimate the parameters of the series
1
2
3
4
5
6
7
8
9
10
11
12
13
14
15
16
17
18
19
20
21
22
~ 3
23
A
i
1
2
3
4
5
6
7
8
9
10
11
12
13
14
15
16
17
18
19
20
21
22
B
Year
1948
1948
1948
1948
1948
1948
1948
1948
1948
1948
1948
1948
1949
1949
1949
1949
1949
1949
1949
1949
1949
1949
Sheet1
с
Month
Jan
Feb
Mar
Apr
May
Jun
Jul
Aug
Sep
Oct
Nov
Dec
Jan
Feb
Mar
Apr
May
Jun
Jul
Aug
Sep
Oct
+
D
X₁
278
310
298
225
185
385
356
274
197
166
189
203
295
294
318
301
349
550
478
408
294
290
E
X₂
1511
1694
1614
1482
1245
1108
1195
1177
1146
981
1163
1344
1923
2292
2267
2081
2154
2163
2547
2293
2115
2419
F
X3
116
153
142
139
93
323
256
152
138
90
128
104
149
180
169
171
193
388
356
230
271
190
G
X4
446
650
592
561
491
592
604
635
580
510
553
554
628
708
629
724
820
865
1007
1025
955
889
H
Expert Solution
This question has been solved!
Explore an expertly crafted, step-by-step solution for a thorough understanding of key concepts.

Step by stepSolved in 1 steps

Knowledge Booster

Similar questions
- Can someone please help me with this questionarrow_forwardPls asaparrow_forwardProvide an appropriate response using correct mathematical notation and vocabulary in the space below. Use the equation editor as needed for mathematical notation.On a recent Statistics test, the scores were 15, 66, 66, 81, 82, 83, 85, 88, 90, 92, 93, and 95. Is the mean a good representation of the center of data? If not, explain why not and identify a better representation of the center of data.arrow_forward
arrow_back_ios
arrow_forward_ios
Recommended textbooks for you
- MATLAB: An Introduction with ApplicationsStatisticsISBN:9781119256830Author:Amos GilatPublisher:John Wiley & Sons Inc
 Probability and Statistics for Engineering and th...StatisticsISBN:9781305251809Author:Jay L. DevorePublisher:Cengage Learning
 Statistics for The Behavioral Sciences (MindTap C...StatisticsISBN:9781305504912Author:Frederick J Gravetter, Larry B. WallnauPublisher:Cengage Learning
  Elementary Statistics: Picturing the World (7th E...StatisticsISBN:9780134683416Author:Ron Larson, Betsy FarberPublisher:PEARSON
 The Basic Practice of StatisticsStatisticsISBN:9781319042578Author:David S. Moore, William I. Notz, Michael A. FlignerPublisher:W. H. Freeman
 Introduction to the Practice of StatisticsStatisticsISBN:9781319013387Author:David S. Moore, George P. McCabe, Bruce A. CraigPublisher:W. H. Freeman
MATLAB: An Introduction with Applications
Statistics
ISBN:9781119256830
Author:Amos Gilat
Publisher:John Wiley & Sons Inc
Probability and Statistics for Engineering and th...
Statistics
ISBN:9781305251809
Author:Jay L. Devore
Publisher:Cengage Learning
Statistics for The Behavioral Sciences (MindTap C...
Statistics
ISBN:9781305504912
Author:Frederick J Gravetter, Larry B. Wallnau
Publisher:Cengage Learning
Elementary Statistics: Picturing the World (7th E...
Statistics
ISBN:9780134683416
Author:Ron Larson, Betsy Farber
Publisher:PEARSON
The Basic Practice of Statistics
Statistics
ISBN:9781319042578
Author:David S. Moore, William I. Notz, Michael A. Fligner
Publisher:W. H. Freeman
Introduction to the Practice of Statistics
Statistics
ISBN:9781319013387
Author:David S. Moore, George P. McCabe, Bruce A. Craig
Publisher:W. H. Freeman