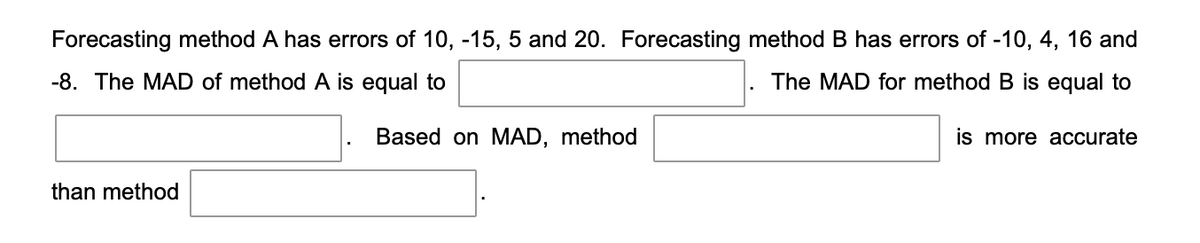
Forecasting method A has errors of 10, -15, 5 and 20. Forecasting method B has errors of -10, 4, 16 and -8. The MAD of method A is equal to The MAD for method B is equal to is more accurate than method Based on MAD, method


Q: The Money Pit Mortgage Company is interested in monitoring the performance of the mortgage process.…
A: Use the following formulas: X-bar chart Upper control limit (UCL)=x ¯¯+zσxLower control limit…
Q: The research department of Unilever Ltd has recommended to the marketing department to launch a…
A: Given data is
Q: A firm has established a distribution network for the supply of a raw material critical to its…
A: When supply is less than demand or vice versa, it is called as unbalanced problem. For unbalanced…
Q: Year Year Forecast (000) 1 2 3 4.00 7.00 5.00 1 5.00 Registrations (000) a) Calculate the forecasted…
A: The exponential smoothing forecast is a form of time series forecasting that is used to predict…
Q: For a population, N = 14,000, μ = 110, and o 19. Find the z value for x = 128.60 for n = 36. Round…
A: Given data: µ = 110 σ = 19 X¯ = 128.60 n = 36 N = 14,000
Q: Solve the problem for each of the following objective functions: (Two-Pha Method) (a) Maximize z 2x1…
A: As per Bartleby guidelines, we can only solve the first three subparts of one question at a…
Q: 2) A software developer has four project proposals for new accounting software. This company cannot…
A: Given data is Project Programmers req Capital req ($) Returns ($) 1 7 250,000 650,000 2 9…
Q: An institution has 7 departments. The closeness chart is given in the following table. 1. Material…
A: Here consider: Here 1 Material Storage 2 Forming 3 Machining 4 Painting 5 Assembly…
Q: K The following table gives the map coordinates and the shipping loads for a set of cities that we…
A: The best method for calculating the location for central hub is center of gravity method. This…
Q: Howard Weiss, Inc., is considering building a sensitive new radiation scanning device. His…
A: Given data: The Probability that ATR competes with assembly line =0.35 ,payoff = $20,000…
Q: If the lead time is six days, what is the reorder point for both the no-backorder and backorder…
A: Monthly Demand = 50 Annual demand (D) = 50*12 =600 Number of business days = 300 Days in a month =…
Q: Describe the differences between input and output in healthcare budgeting.Explain it?
A: Inputs can be understood as all the resources that a business uses in order to carry out the…
Q: Mini-Case Studies In the two following mini-case studies, imagine that you are the manager of food…
A: Case 1: In this case, there are two problems. Problem 1 - Stockouts (The products are not available…
Q: A company is considering three vendors for purchasing a CRM system: Delphi Inc., CRM International,…
A: Decision analysis is the approach to selecting the best alternative based on the available…
Q: Which data analytics type focuses on answering the question “How many computer monitors should we…
A: a. Prescriptive analytics:- This type of analytics the details analysis of the factors and other…
Q: What is the cost of the connection between nodes K and I?
A: The diagram given represents the cities from A to M through various routes drawn with the help of…
Q: Dr. Quack uses chemicals X and Y to produce two drugs. Drug A must be at least 70% of chemical X,…
A: Objective Functions and Constraints: Based on the given details, the objective…
Q: In no less than 200 words, describe the connection between “quality” and “strategy.”
A: The term quality defines good or bad, success or failure, and right or wrong of the resultant…
Q: An Assembly line with 17 tasks is to be balanced. The longest task is 2.2 minutes, and the total…
A: An assembly line indicating the task allocation to the workstation based on different heuristics.…
Q: Owen Conner works part-time packaging software for a local distribution company in Indiana. The…
A: Breakeven point indicating the unit level or revenue level which facilitating no cost or loss. Here,…
Q: Identify a business problem for the business plan of natural hair products that has effects on…
A: As per the question Instructions, I would identify one business problem, which is related to the…
Q: What is the average lines per order for the set of multi-line orders?
A: Given: Average lines per order = 2.8 Single line order = 60%
Q: 1. Inventory Problem Figure 6 shows the inventory levels of dried Rainier cherries at a natural food…
A: From the graph given following data can be obtained. Inventory range = 180 pounds Order-reorder…
Q: What is organizational behavior
A: Ans) Organizational Behaviour is defined as the study of human behaviour in organization environment…
Q: Find the least expensive route from I to L and state its cost 120 K 120 150 40 P 30 100 70 30/ N 50…
A: The shortest route method is an optimization technique of network models. Based on the input and…
Q: 8. Consider the warehouse location decision facing CupAMoe's (Example 8.60). a. (**) Suppose Robbie…
A: Given data is Coordinates of Capital City = (1,5) Coordinates of Springfield = (4.5,3) Coordinates…
Q: I just need help with D AND E Please!! The answer that i have for D was wrong and cant figure it…
A: Given-
Q: Note: This question requires Solver. Formulate the problem in Solver and find the optimal solution.…
A: Operation management is performed in each manufacturing organization. It all deals with the…
Q: What is the average number of errors per order? Do not round intermediate calculations. Round your…
A: c-bar = Average number of errors per order = Total Errors/Total Samples =…
Q: Construct the Project Network Diagram 2.Find the Expected Duration and Standard Deviation and…
A: The critical path is a method for determining the most efficient way to complete a project. It…
Q: What is the BEST source of lighting for a web conference? O an uncovered window behind you O a soft…
A: Web conferences means meeting virtually using laptop or desktop with web cam on. Communication is…
Q: Q-2) A company makes two kinds of door Knobs, standard and deluxe ,the making process cost the…
A: Decision variables: Suppose- S = be the no. of standard door Knobs produced by the company D= be the…
Q: Johnson Electronics Corporation makes electric tubes. It is known that the standard deviation of the…
A: Given data: Mean (μ)= 2300 Standard deviation (σ) = 145 Sample size (n) =90
Q: What is Dimitri's Productivity per Labor hour? He had 105 orders processed, he worked 8 hours, and…
A: Given: Output = 105 Hours worked = 8 hrs Salary = $15 per hr
Q: 8. One bag of "Fertilizer A" contains 2 units of phosphorus, 5 units of nitrogen, and 3 units of…
A: Based on the given information, the LP formulation will be as follows. Objective Function:Minimize…
Q: To monitor the number of blemishes on a polished surface a company randomly selects 10 units of…
A: C-chart is a model of control chart which identifying the controllability based on counted type of…
Q: Draw out the below process: Customer places an order, the order is the specified a delivery time…
A: Different steps found in the given process are listed below. Placing an order with a delivery time…
Q: fter spending $300,000 for research and development, chemists at Diversified Citrus Industries have…
A: Find the Calculations below: Calculations Methods: Selling Price to Wholesalers = Retail Price -…
Q: Develop a Pareto chart of the following causes of poor grades on an exam: Number 1 2 3 4 5 Choose…
A: I have entered the given Data: Now Arrange the above data from High to low, i.e. Highest Frequency…
Q: You are trying to invest $100,000 in a portfolio of stocks and bonds. You want the highest return…
A: Given data is
Q: Refer to Table S6 1-Factors for Computing Control Chart Limits (3 sigma) for this problem.…
A: Control chart helps to the business to analysis the how process change over time. It has a three…
Q: Explain the meaning of the term production or operations and describe the three kinds of utility…
A: NOTE: We are allowed to do one question only at a time. Operations processes are the backbone of any…
Q: The overall average on a process you are attempting to monitor is 60.0 units. The process population…
A: Control charts are also known as process-behaviour charts. It is a statistical process that helps in…
Q: East Coast Trucking provides service from Boston to Miami using regional offices located in Boston,…
A: Find the Given details below: The Given details are reframed below: Given details: Boston New…
Q: 9- All of these are key areas of a typical spend analysis except a-Spend by division, department, or…
A: Spend Analysis is related to Strategic Planning and Execution. It is one of the processes carried…
Q: Procurement is just like plants and animals, it’s born, it grows, it matures and eventually dies’.…
A: The process and methods involved in purchasing or obtaining any material, good or thing that a…
Q: Find attached the scenario - Discuss possible ways that Checkers can utilise evaluate and select a…
A: Suppliers are one of the core elements of a business. They are the driving force for any business…
Q: Consider the network described in the table below. Activity Immediate Predecessor(s)…
A: A network diagram is a visual representation of a project which helps to identify the critical path…
Q: Consider the following linear program and answer the following questions. -1A + 2B ≤9 1A + 2B ≤ 11…
A: Find the standard form below: A, B, S1, S2, S3 ≥ 0
Q: How do you evaluate a forecasting model please use a hypothetical example?
A: NOTE: We are allowed to do one question only. Evaluating a forecasting model is the process of…


Trending now
This is a popular solution!

Step by step
Solved in 3 steps with 4 images

- The file P13_28.xlsx contains monthly retail sales of U.S. liquor stores. a. Is seasonality present in these data? If so, characterize the seasonality pattern. b. Use Winters method to forecast this series with smoothing constants = = 0.1 and = 0.3. Does the forecast series seem to track the seasonal pattern well? What are your forecasts for the next 12 months?Suppose that a regional express delivery service company wants to estimate the cost of shipping a package (Y) as a function of cargo type, where cargo type includes the following possibilities: fragile, semifragile, and durable. Costs for 15 randomly chosen packages of approximately the same weight and same distance shipped, but of different cargo types, are provided in the file P13_16.xlsx. a. Estimate a regression equation using the given sample data, and interpret the estimated regression coefficients. b. According to the estimated regression equation, which cargo type is the most costly to ship? Which cargo type is the least costly to ship? c. How well does the estimated equation fit the given sample data? How might the fit be improved? d. Given the estimated regression equation, predict the cost of shipping a package with semifragile cargo.The file P13_29.xlsx contains monthly time series data for total U.S. retail sales of building materials (which includes retail sales of building materials, hardware and garden supply stores, and mobile home dealers). a. Is seasonality present in these data? If so, characterize the seasonality pattern. b. Use Winters method to forecast this series with smoothing constants = = 0.1 and = 0.3. Does the forecast series seem to track the seasonal pattern well? What are your forecasts for the next 12 months?
- Stock market analysts are continually looking for reliable predictors of stock prices. Consider the problem of modeling the price per share of electric utility stocks (Y). Two variables thought to influence this stock price are return on average equity (X1) and annual dividend rate (X2). The stock price, returns on equity, and dividend rates on a randomly selected day for 16 electric utility stocks are provided in the file P13_15.xlsx. Estimate a multiple regression equation using the given data. Interpret each of the estimated regression coefficients. Also, interpret the standard error of estimate and the R-square value for these data.The file P13_26.xlsx contains the monthly number of airline tickets sold by the CareFree Travel Agency. a. Create a time series chart of the data. Based on what you see, which of the exponential smoothing models do you think will provide the best forecasting model? Why? b. Use simple exponential smoothing to forecast these data, using a smoothing constant of 0.1. c. Repeat part b, but search for the smoothing constant that makes RMSE as small as possible. Does it make much of an improvement over the model in part b?The file P13_19.xlsx contains the weekly sales of a particular brand of paper towels at a supermarket for a one-year period. a. Using a span of 3, forecast the sales of this product for the next 10 weeks with the moving averages method. How well does this method with span 3 forecast the known observations in this series? b. Repeat part a with a span of 10. c. Which of these two spans appears to be more appropriate? Justify your choice.
- The Baker Company wants to develop a budget to predict how overhead costs vary with activity levels. Management is trying to decide whether direct labor hours (DLH) or units produced is the better measure of activity for the firm. Monthly data for the preceding 24 months appear in the file P13_40.xlsx. Use regression analysis to determine which measure, DLH or Units (or both), should be used for the budget. How would the regression equation be used to obtain the budget for the firms overhead costs?The file P13_42.xlsx contains monthly data on consumer revolving credit (in millions of dollars) through credit unions. a. Use these data to forecast consumer revolving credit through credit unions for the next 12 months. Do it in two ways. First, fit an exponential trend to the series. Second, use Holts method with optimized smoothing constants. b. Which of these two methods appears to provide the best forecasts? Answer by comparing their MAPE values.A small computer chip manufacturer wants to forecast monthly ozperating costs as a function of the number of units produced during a month. The company has collected the 16 months of data in the file P13_34.xlsx. a. Determine an equation that can be used to predict monthly production costs from units produced. Are there any outliers? b. How could the regression line obtained in part a be used to determine whether the company was efficient or inefficient during any particular month?
- The management of a technology company is trying to determine the variable that best explains the variation of employee salaries using a sample of 52 full-time employees; see the file P13_08.xlsx. Estimate simple linear regression equations to identify which of the following has the strongest linear relationship with annual salary: the employees gender, age, number of years of relevant work experience prior to employment at the company, number of years of employment at the company, or number of years of post secondary education. Provide support for your conclusion.The file P13_02.xlsx contains five years of monthly data on sales (number of units sold) for a particular company. The company suspects that except for random noise, its sales are growing by a constant percentage each month and will continue to do so for at least the near future. a. Explain briefly whether the plot of the series visually supports the companys suspicion. b. By what percentage are sales increasing each month? c. What is the MAPE for the forecast model in part b? In words, what does it measure? Considering its magnitude, does the model seem to be doing a good job? d. In words, how does the model make forecasts for future months? Specifically, given the forecast value for the last month in the data set, what simple arithmetic could you use to obtain forecasts for the next few months?The file P13_22.xlsx contains total monthly U.S. retail sales data. While holding out the final six months of observations for validation purposes, use the method of moving averages with a carefully chosen span to forecast U.S. retail sales in the next year. Comment on the performance of your model. What makes this time series more challenging to forecast?