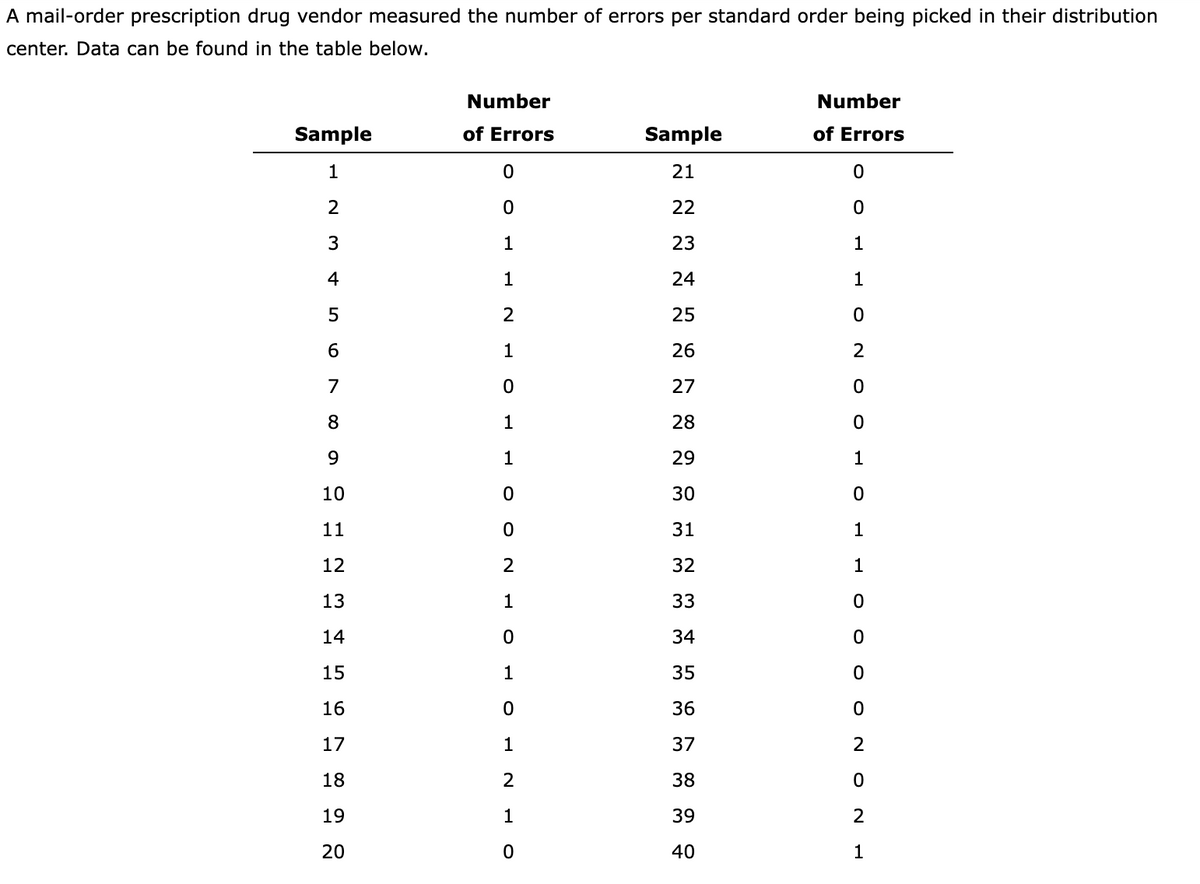
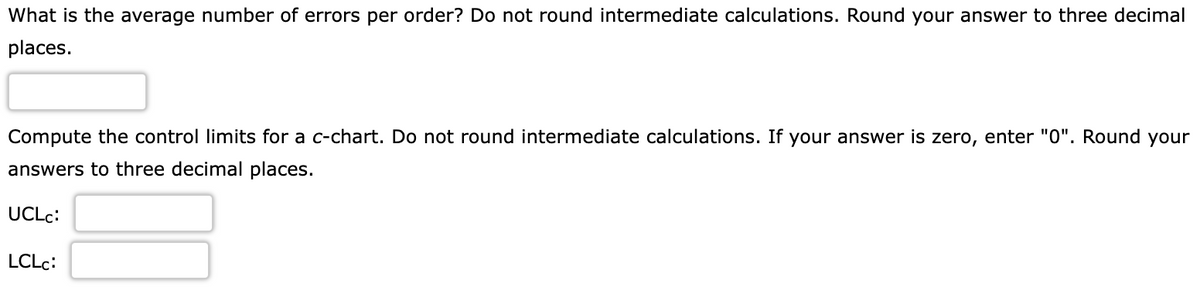
What is the average number of errors per order? Do not round intermediate calculations. Round your answer to three decimal places. Compute the control limits for a c-chart. Do not round intermediate calculations. If your answer is zero, enter "0". Round your answers to three decimal places. UCLC: LCLC:


Q: Explain key aspects of operation management decision making.
A: Introduction : Decision-making is vital to every aspect of operation management. It is one of the…
Q: A restaurant considers changing the number of waiters during dinner hours. There are currently…
A: Given: Arrival rate (lambda) = 12.28 mins = 60/12.28 = 4.88 customers/hr Service rate (mu) = 70 mins…
Q: A toll tunnel has decided to experiment with the use of a debit card for the collection of tolls.…
A: Given data: Arrival Rate λ = 750 cars/hour Service Rateµ = 1 card 4 sec/car = 3600 sec per hour…
Q: Find the optimal solution to this linear programming problem. Min 3X+3Y s.t. 12X+4Y>=60…
A: NOTE : As no particular, method has been specified, I have solved this using graphical method.…
Q: a) Draw a network diagram. b) List all the paths and their durations c) Find the critical path. d)…
A: Here, I have been given the activity table, for each activity, I have been given the immediate…
Q: The actual number of patients at Providence Emergency Medical Clinic for the first six weeks of this…
A: Parts a) and b) are solved and answers are updated in the question. We will solve question part c).…
Q: fter spending $300,000 for research and development, chemists at Diversified Citrus Industries have…
A: Find the Calculations below: Calculations Methods: Selling Price to Wholesalers = Retail Price -…
Q: An accounting firm is capable of processing 20 EZ tax forms per day, and the average number of forms…
A: Queuing theory is the study of waiting for lines/queues. This model helps to determine the length…
Q: The "bullwhip effect" is a term that refers to the buildup of inventory in a supply chain resulting…
A: A distribution chain connecting the merchant to the producer is a part of every supply chain. As…
Q: The ABC Firefighting Equipment company has two assembly plants: Plant A in Atlanta and plant B in…
A:
Q: What are the benefits that Nissan would gain by adopting these additional principles.
A: Developed by Edwards Deming, TQM stands for total quality management. It is a process of continuous…
Q: A feasible solution is one that satisfies all the constraints of a linear programming problem…
A: Linear programming is a mathematical technique that is also used in operations management…
Q: A project is scheduled to complete in six months duration. There are two activities in the project.…
A: Actual cost of Activity 1 = AC1 = SAR 300,000 Actual cost of Activity 2 = AC2 = SAR 200,000 Planned…
Q: Briefly describe the term project management. Describe what a project manager does.
A: A project is exceptional, quick work, undertaken to achieve planned goals, which could be…
Q: Identify the appropriate inventory model to obtain the optimal lot size for the given problem…
A: Find out the number of T-shirts Rick should order so as to maximize his expected profits.
Q: Explain the meaning of the term production or operations and describe the three kinds of utility…
A: NOTE: We are allowed to do one question only at a time. Operations processes are the backbone of any…
Q: A grocery store manager must decide how to best present a limited supply of milk and cookies to its…
A: Decision variables: Suppose-M be the amount of milk sold separatelyC be the number of cookies sold…
Q: C&A's production sequence is making 200 pounds of wheat first, then switching to 100 pounds of white…
A: Given that the initial Inventory for white bread=200 pounds The Ending inventory for white bread=100…
Q: I am not sure why these are incorrect
A: Given data is Objective function: Max Z=1x1+1x2 Subject to constraints: 1.) 5x1+6x2≤412.)…
Q: M-Method. Consider the following set of constraints: X1 + X2 + x3 = 7 2x1 - 5x2 + x3 > 10 X1, X2, X3…
A: Max Z = 2 x1 + 3 x2 - 5 x3 subject to x1 + x2 + x3 = 7 2 x1 - 5 x2 + x3…
Q: The production process shown below consists of five stages. The numbers in parentheses are the times…
A: Find the Given details below: Given details: Stage Time taken for an unit A 4 minutes B 3…
Q: The chart below is given to highlight on the process of Operations Management. Accordingly answer…
A: Here, I have been given a chart where we could see that inputs are fed through the production…
Q: Explain how waiting lines can develop even when the service time is a constant.
A: The waiting line is the length of time that a customer has to wait before they are served. The…
Q: a) What is the value of your forecast? The value of the forecast is patients (round your response to…
A: Forecasting is a technique used to predict future outcomes on the basis of past data. In businesses…
Q: (c) Suppose that management wants to provide additional security coverage for room 7. Specifically,…
A: The decision variables are already given. Objective function: Min…
Q: Q-2) A company makes two kinds of door Knobs, standard and deluxe ,the making process cost the…
A: Decision variables: Suppose- S = be the no. of standard door Knobs produced by the company D= be the…
Q: Article 1: South African pears will soon be on sale in China for the first time • Consumers in China…
A: Mainly, the company can use two transport modes to get their products to China, they are airways and…
Q: 8. The capacity of a process is determined by OA. the flow of materials. OB. the maximum of the…
A: A process is any sequence of steps that produces a specific outcome.
Q: Scenario 14.1 — Vidalia Onions When Vidalia onions are ready, the entire 13 county (plus parts of…
A: Given data: The safety inventory requires = 30% of lead time demand Holding cost for a bag =15% of…
Q: The overall average on a process you are attempting to monitor is 60.0 units. The process population…
A: Control charts are also known as process-behaviour charts. It is a statistical process that helps in…
Q: ABC Ltd Company is in the process of preparing a budget for launching a new product. The following…
A: As per Bartleby guidelines, we can only solve one question at a time...Kindly upload the other…
Q: a. How many kilograms of each mix should the company prepare for the maximum revenue? Find the…
A: Here, this is an optimization problem, we need to maximize the total revenue value, First, I would…
Q: Arnold Tofu owns and operates a chain of 12 vegetable protein “hamburger” restaurants in northern…
A: An estimate of the line that depicts the actual but unidentified linear connection between the two…
Q: Consider the simplex tableau given below. X₁ x₂ X3 $₁ S₂ S3 3 0 1 3 0 0 0 0 0 -2 2 1 2 0 x₂ = O X₁,…
A: The simplex method is an algebraic technique to solve linear programming questions. Using the…
Q: Company X is the leading producer of state-of-the-art printers. They have been developing a layout…
A: Organizations are daily getting indulged in their complex operations that bring about a big change…
Q: You want to develop a three-sigma R-Chart. You know the average range is 6 based on several samples…
A: A control chart is a graphical representation of data that is used to monitor or improve the…
Q: Hart Manufacturing makes three products. Each product requires manufacturing operations in three…
A: As per the given instructions, the decision variables are as follows. P1 = Units of product 1…
Q: analyse the role of operations management capacity planning and control in a clothing business and…
A: Operations management is the process of designing, implementing, and controlling the production and…
Q: Question 2: State whether the following statements are true or false. If the statement is false,…
A: Operations management is a field of study that includes all about maintaining the quality of work…
Q: Given the following historical data, what is the simple three-period moving average forecast for…
A: 3-period moving average forecast is calculated the sum of last three period and divided by 3 .
Q: RMC, Inc., is a small firm that produces a variety of chemical products. In a particular production…
A: Material 1 Material 2 Material 3 Profit Fuel additive 0.4 0 0.6 $40 Solvent base 0.5 0.2 0.3…
Q: What is the term used in project management for when new project requirements are added to the scope…
A: Before executing a project, the scope of the project is firmed up in order to have clarity of the…
Q: Outline the organisational documentation applicable to project integration and associated processes.
A: Integration management in projects is a sub field of project management that facilitates effective…
Q: Data collected on the yearly registrations for a Six Sigma seminar at the Quality College Year 1…
A: A time series forecasting technique called exponential smoothing may be expanded to handle data with…
Q: Which of the following statements is not true about efficient supply chains? a. Lower cost through…
A: Here, there are multiple statements, I have to select a specific statement, which is not correct…
Q: Construct the Project Network Diagram 2.Find the Expected Duration and Standard Deviation and…
A: The critical path is a method for determining the most efficient way to complete a project. It…
Q: Mini-Case Studies In the two following mini-case studies, imagine that you are the manager of food…
A: Case 1: In this case, there are two problems. Problem 1 - Stockouts (The products are not available…
Q: what is the pareto chart and discuss its benefits and application in the project management field.
A: The Pareto Principle, usually referred to/known as the 80/20 rule, argues that 20% of the labor can…
Q: The production planner for Fine Coffees, Inc. produces two coffee blends: American (A) and British…
A: The detailed solution is given in Step 2
Q: What role does inventory management play in an overall business plan and describe the benefits of…
A: *As per guidelines in multiple questions first one is answerable.The inventory management process in…

Step by step
Solved in 3 steps

- The file P14_01.xlsx contains data on 100 consumers who drink beer. Some of them prefer light beer, and others prefer regular beer. A major beer producer believes that the following variables might be useful in discriminating between these two groups: gender, marital status, annual income level, and age. a. Use logistic regression to classify the consumers on the basis of these explanatory variables. How successful is it? Which variables appear to be most important in the classification? b. Consider a new customer: Male, Married, Income 42,000, Age 47. Use the logistic regression equation to estimate the probability that this customer prefers Regular. How would you classify this person?The Baker Company wants to develop a budget to predict how overhead costs vary with activity levels. Management is trying to decide whether direct labor hours (DLH) or units produced is the better measure of activity for the firm. Monthly data for the preceding 24 months appear in the file P13_40.xlsx. Use regression analysis to determine which measure, DLH or Units (or both), should be used for the budget. How would the regression equation be used to obtain the budget for the firms overhead costs?The file P13_26.xlsx contains the monthly number of airline tickets sold by the CareFree Travel Agency. a. Create a time series chart of the data. Based on what you see, which of the exponential smoothing models do you think will provide the best forecasting model? Why? b. Use simple exponential smoothing to forecast these data, using a smoothing constant of 0.1. c. Repeat part b, but search for the smoothing constant that makes RMSE as small as possible. Does it make much of an improvement over the model in part b?
- Management of a home appliance store would like to understand the growth pattern of the monthly sales of Blu-ray disc players over the past two years. Managers have recorded the relevant data in the file P13_33.xlsx. a. Create a scatterplot for these data. Comment on the observed behavior of monthly sales at this store over time. b. Estimate an appropriate regression equation to explain the variation of monthly sales over the given time period. Interpret the estimated regression coefficients. c. Analyze the estimated equations residuals. Do they suggest that the regression equation is adequate? If not, return to part b and revise your equation. Continue to revise the equation until the results are satisfactory.The file P13_25.xlsx contains the quarterly numbers of applications for home mortgage loans at a branch office of Northern Central Bank. a. Create a time series chart of the data. Based on what you see, which of the exponential smoothing models do you think will provide the best forecasting model? Why? b. Use simple exponential smoothing to forecast these data, using a smoothing constant of 0.1. c. Repeat part b, but search for the smoothing constant that makes RMSE as small as possible. Does it make much of an improvement over the model in part b? Is it guaranteed to produce better forecasts for the future?The file P13_22.xlsx contains total monthly U.S. retail sales data. While holding out the final six months of observations for validation purposes, use the method of moving averages with a carefully chosen span to forecast U.S. retail sales in the next year. Comment on the performance of your model. What makes this time series more challenging to forecast?
- The file P13_02.xlsx contains five years of monthly data on sales (number of units sold) for a particular company. The company suspects that except for random noise, its sales are growing by a constant percentage each month and will continue to do so for at least the near future. a. Explain briefly whether the plot of the series visually supports the companys suspicion. b. By what percentage are sales increasing each month? c. What is the MAPE for the forecast model in part b? In words, what does it measure? Considering its magnitude, does the model seem to be doing a good job? d. In words, how does the model make forecasts for future months? Specifically, given the forecast value for the last month in the data set, what simple arithmetic could you use to obtain forecasts for the next few months?Do the sales prices of houses in a given community vary systematically with their sizes (as measured in square feet)? Answer this question by estimating a simple regression equation where the sales price of the house is the dependent variable, and the size of the house is the explanatory variable. Use the sample data given in P13_06.xlsx. Interpret your estimated equation, the associated R-square value, and the associated standard error of estimate.The management of a technology company is trying to determine the variable that best explains the variation of employee salaries using a sample of 52 full-time employees; see the file P13_08.xlsx. Estimate simple linear regression equations to identify which of the following has the strongest linear relationship with annual salary: the employees gender, age, number of years of relevant work experience prior to employment at the company, number of years of employment at the company, or number of years of post secondary education. Provide support for your conclusion.
- Management of a home appliance store wants to understand the growth pattern of the monthly sales of a new technology device over the past two years. The managers have recorded the relevant data in the file P13_05.xlsx. Have the sales of this device been growing linearly over the past 24 months? By examining the results of a linear trend line, explain why or why not.The file P13_19.xlsx contains the weekly sales of a particular brand of paper towels at a supermarket for a one-year period. a. Using a span of 3, forecast the sales of this product for the next 10 weeks with the moving averages method. How well does this method with span 3 forecast the known observations in this series? b. Repeat part a with a span of 10. c. Which of these two spans appears to be more appropriate? Justify your choice.The file P13_29.xlsx contains monthly time series data for total U.S. retail sales of building materials (which includes retail sales of building materials, hardware and garden supply stores, and mobile home dealers). a. Is seasonality present in these data? If so, characterize the seasonality pattern. b. Use Winters method to forecast this series with smoothing constants = = 0.1 and = 0.3. Does the forecast series seem to track the seasonal pattern well? What are your forecasts for the next 12 months?