In which of the following years (see attached below) did the number of graduate student applications increase the most from that of the previous year? QZ.pdf 1985 OA. 1986 В. 1990 1991 NUMBER OF GRADUATE STUDENT APPLICANTS AT UNIVERSITY X, 1982-1991 1,400 1,200 1,000 800 600 400 200 '82 '83 '84 '85 '86 '87 '88 '89 90 '91
In which of the following years (see attached below) did the number of graduate student applications increase the most from that of the previous year? QZ.pdf 1985 OA. 1986 В. 1990 1991 NUMBER OF GRADUATE STUDENT APPLICANTS AT UNIVERSITY X, 1982-1991 1,400 1,200 1,000 800 600 400 200 '82 '83 '84 '85 '86 '87 '88 '89 90 '91

Glencoe Algebra 1, Student Edition, 9780079039897, 0079039898, 2018
18th Edition
ISBN:9780079039897
Author:Carter
Publisher:Carter
Chapter10: Statistics
Section10.1: Measures Of Center
Problem 9PPS

Related questions

Concept explainers
Ratios
A ratio is a comparison between two numbers of the same kind. It represents how many times one number contains another. It also represents how small or large one number is compared to the other.
Trigonometric Ratios
Trigonometric ratios give values of trigonometric functions. It always deals with triangles that have one angle measuring 90 degrees. These triangles are right-angled. We take the ratio of sides of these triangles.
Question
100%
please see photo
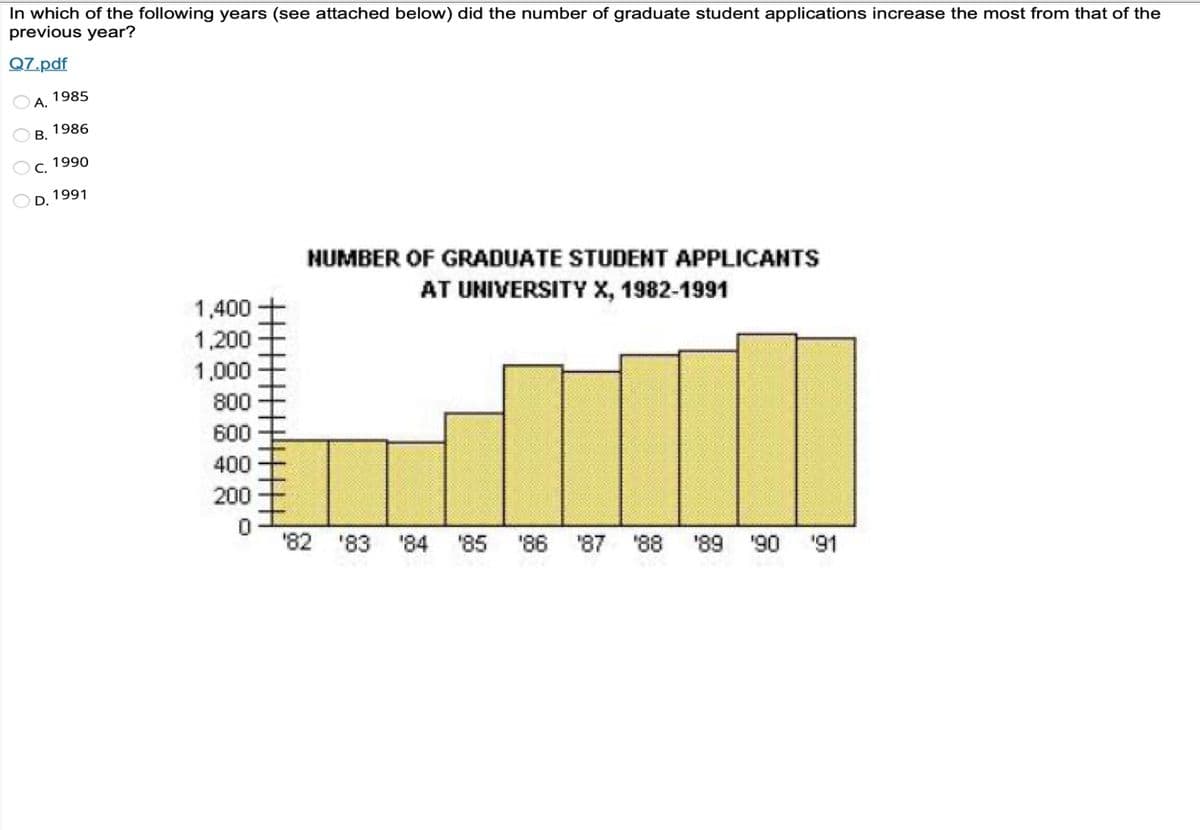
Transcribed Image Text:In which of the following years (see attached below) did the number of graduate student applications increase the most from that of the
previous year?
Q7.pdf
1985
A.
1986
В.
1990
D. 1991
NUMBER OF GRADUATE STUDENT APPLICANTS
AT UNIVERSITY X, 1982-1991
1,400
1,200
1,000
800
600
400
200
'82 '83 '84
'85
'86 '87
88.
'89 '90
'91
Expert Solution
This question has been solved!
Explore an expertly crafted, step-by-step solution for a thorough understanding of key concepts.

This is a popular solution!

Trending now
This is a popular solution!

Step by step
Solved in 2 steps

Knowledge Booster


Learn more about
Need a deep-dive on the concept behind this application? Look no further. Learn more about this topic, algebra and related others by exploring similar questions and additional content below.Recommended textbooks for you
Glencoe Algebra 1, Student Edition, 9780079039897…
Algebra
ISBN:
9780079039897
Author:
Carter
Publisher:
McGraw Hill
Glencoe Algebra 1, Student Edition, 9780079039897…
Algebra
ISBN:
9780079039897
Author:
Carter
Publisher:
McGraw Hill