FromSassampleSof n = 15 readingsSon X = Traffic$Volume$(carsSperShours) Sand Y = Carbon Monoxide Concentrations (PPM)S takenS at$ certains metropolitans air$ qualitys samplingSsites,SweShaveStheseSstatistics$(seeSthe image$belowS). TestSwhetherSthereSissa SsignificantSrelationshipSbetweenStheSvariablesSatsa 50% levelSofsignificances. Σx = 3,550 Еу %3D 167.8 Ex = 974, 450 Ey = 1,915. 36 E xy = 41, 945 Calculate the slope.
Q: Given that Samuel is collecting data on the number of meals that students eat in a week, what type…
A: Given - Data on the number of meals that students eat in a week
Q: Life-saving drug: Penicillin is produced by the Penicillium fungus, which is grown in a broth whose…
A: (A) Construct the ANOVA table. Use EXCEL Procedure to obtain the ANOVA table. Follow the instruction…
Q: Week Labour, (hr) Pounds Shipped (1,000s) Percentage of Units Shipped by Truck Average Shipment…
A: There are 3 independent variables and 1 dependent variable. We have to find the total sum of squares…
Q: A medium-sized asset management Tirm has 56 fur have their own portfolio. The percentage returns…
A:
Q: Construct a horizontal bar graph on the data on common types of pre-treatment used for hospital…
A:
Q: An economist is studying the job market in Denver area neighborhoods. Let x represent the total…
A: A Scatter plot is a nonmathematical study of the relationship between the variable. In this graph x…
Q: B C D E pop. Serial # Income Food Expenses (Y) Highest Degree Family Size(X) Head of Household…
A: Simple linear Regression: Linear Regression analysis is used to measure the association or linear…
Q: The following table gives the annual natural gas production, in trillions of cubic feet per year, in…
A:
Q: carpet manufacturing cleaning company has a seasonal pattern of daily mail volume every week. The…
A: Data given for week 1 & 2 We have to forcast the volume for each day of week if 30,000 piece to…
Q: FromSassampleSof n = 15 readingsSon X = TrafficSVolumeS(carsSperShourS) Sand Y = Carbon Monoxide…
A: The null hypothesis is a nullified statement, which one want to prove or disprove. The contradictory…
Q: An article in Journal of Food Science (2001, Vol. 66, No. 3, pp. 472-477) studied potato spoilage…
A:
Q: Chart 23: Model of Cumulativ& Cases of Coronavirus with Social Distancing Measures Taken One Day…
A: There are three graphs above Black, Red and GreenFor exponential function: the slope (f'(x)) is…
Q: The table to the right gives the cost of living index (COLI) for six East Coast counties and six…
A: Given: East Coast Counties Midwest Counties A 104.1 96.4 B 128.3 92.7 C 314.5 94.2 D…
Q: The weight of a newborn is an example of O Quantitative discrete O Qualitative ordinal O Qualitative…
A: It is given that the statement about to the type of data variable. Here, need to find out the…
Q: Stoaches are fictional creatures with distinctive octarine stripes. Unfortunately they are…
A: A hypothesis which is tested for plausible rejection is called the Null Hypothesis (typically…
Q: d. Using α = 0.01, test H0 : β1 = 0 vs. H1 : β1 6= 0 e. Imagine that the next solid reduction level…
A: Since you have posted a question with multiple subparts, we will solve first three subparts for you.…
Q: The following table shows 10 communities ranked by decayed, missing, or filled (DMF) teeth per 100…
A: The ranks given are as follows Community RX RY 1 8 1 2 9 3 3 7 4 4 3 9 5 2 8 6 4 7…
Q: Samples are collected from the River X and pH values are observed. 9 different pH values are listed…
A: Introduction: The formula for Bowley’s coefficient of skewness is: SkB = (Q3 –2Q2 + Q1) / (Q3 – Q1).…
Q: 1. Referring to the pollution data of Table 1: Table 1: Measures of Solids and Chemical Oxygen…
A: Use the given data to form regression table in excel: SUMMARY OUTPUT…
Q: The following table shows the amount of converted sugar in a chemical process at different…
A: Solution To find mean amount we will use regression line .
Q: FromSa$sampleSof n = 15 readingsSon X = Traffic$Volume$(carsSperShour$) Sand Y = Carbon Monoxide…
A:
Q: 3. Sports officer collected some information about the Body Mass Index (BMI) and the finishing…
A: Given:- In part 3 BMI and position in marathon is given. first we find the rank of BMI then find the…
Q: FromSassampleSof n = 15 readingsSon X = TrafficSVolumeS(carsSperShourS) Sand Y = Carbon Monoxide…
A:
Q: x Temp (C) 0 x 15 37 100 A B C Foam Height (mm+/1 0.5mm) x D Trial 1 28.0 54.0 ? 0.0 87 85 99 Foam…
A: Here, we can simply take the average of other values at 37 oC to interpolate the value for Group 1.…
Q: The manager of a salmon cannery suspects that the demand for her product is closely related to the…
A: (a) Use EXCEL to construct the scatter plot. EXCEL procedure: Go to EXCEL Go to Insert menu…
Q: FromSasampleSof n = 15 readingsSon X = TrafficSVolumeS(carsSpershours) Sand Y = Carbon Monoxide…
A:
Q: FromSassampleSof n = 15 readingsSon X = Traffic$Volume$(carsSperShours) Sand Y = Carbon Monoxide…
A:
Q: Betts Electronics purchases three replacement parts for robotic machines used in its manufacturing…
A:
Q: Engro group, who recently sold its Engro foods start-up for a multi-million-rupees sum, is looking…
A: K means clustering: Cluster means a group of similar things. K means clustering is the data analysis…
Q: In 1997 Fuller and coworkers at Texas A&M University estimated the operating costs of cotton gin…
A: Hello. Since your question has multiple parts, we will solve first question for you. If you want…
Q: Monica, a chef at a 5-star restaurant makes eight different desserts. She wants to see if the…
A: The categorical variable is dessert. It has 8 categories. We have to find the critical value. This…
Q: Koontz Company manufactures a number of products. The standards relating to one of these products…
A:
Q: FromSassampleSof n = 15 readingsSon X = Traffic$Volume$(cars$per$hour$) Sand Y = Carbon Monoxide…
A: The test is to check whether there is a relationship between the variables X and Y.
Q: II. Identify the following variables as discrete or continuous 1. The height of a building. .... 2.…
A:
Q: The materials handling manager of a manufacturing company is trying to forecast the cost of…
A: It is given that x be the age in years and y is yearly maintenance in dollars.
Q: The electric power consumed each month by a chemical plant is thought to be related to the average…
A: Formula Used: Multiple linear regression: Y = b0 + b1X1 + b2X2 + b3X3 + b4X4 Where, Y is dependent…
Q: FromSassamplesof n = 15 readingsSon X = TrafficSVolume$(carsSperShours) Sand Y = Carbon Monoxide…
A: Correlation is a measure that used to measure the association between the two numerical variable. It…
Q: An article contained the following observations on degree of polymerization for paper specimens for…
A: Mean is the measure used to determine the average measure of the data set. Standard deviation is…
Q: FromSassampleSof n = 15 readingsSon X = Traffic$Volume$(carsSpershours) Sand Y = Carbon Monoxide…
A:
Q: FromSassampleSof n = 15 readings$on X = TrafficSVolumeS(carsSperShour$) Sand Y = Carbon Monoxide…
A: Let the population has the bi-variate variables. From that population, the sample has been taken…
Q: The volume of oxygen consumed (in liters per minute) while a person is at rest and while a person is…
A: Given a scatter plot and we need to determine explanatory variable.
Q: Week Labour, (hr) Pounds Shipped (1,000s) Percentage of Units Shipped by Truck Average…
A: For the given data CALCULATE THE SSR and R2
Q: A chemical company is experimenting with four different mixtures of a chemical designed to kill a…
A:
Q: C. If you have only the marginal totals, how can you determine frequencies for each cell that make…
A:
Q: Week Labour, (hr) Pounds Shipped (1,000s) Percentage of Units Shipped by Truck Average Shipment…
A: The independent variable is pounds shipped. The dependent variable is labour. We have to find the…
Q: No-fines concrete, made from e uniformly graded coerse eggregate and a cement-water paste, is…
A: AS per our guidelines we are suppose to do only one question
Q: The prices (in $) of Rawlston, Inc. stock ( y) over a period of 12 days, the number of shares (in…
A:
Q: C. Identify the following quantitative variables as discrete or continuous 1. Average speed 2.…
A: Discrete variable: The variable which can be counted in numbers are called discrete variables. It…
Q: The table shows data from a science fair experiment that studied the average growth rate of 20…
A: Total samples are 40 combining samples of 70 degrees Fahrenheit and 80 degrees Fahrenheit.
Q: In Star Trek, a (fake) element that often plays a role in the plot is dilithium (Dt), which has…
A: To find the weighted atomic mass
[REAL TENTH QUESTION]
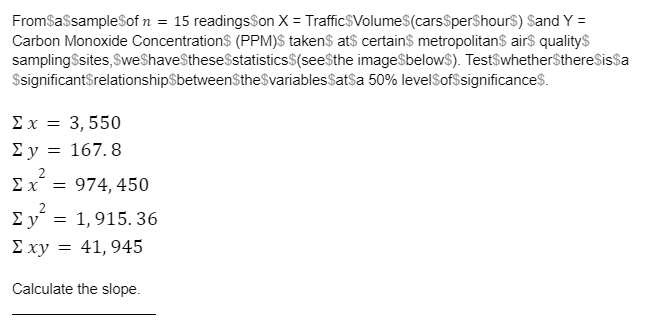
Step by step
Solved in 3 steps with 4 images
- ) The following table shows 10 communities ranked by decayed, missing, or filled (DMF) teeth per 100 children and fluoride concentration in ppm in the public water supply: Rank by DMF Teeth FluorideCommunity per 100 children X Concentration Y 1 8 1 2 9 3 3 7 4 4 3 9 5 2 8 6 4 77 1…A sample of 20 students who had recently taken elementary statistics yielded the following information on brand of calculator owned. (T = Texas Instruments, H = Hewlett Packard, C = Casio, S = Sharp): C T S S T C S H C T H H H H T T T T H T (a) Estimate the true proportion of all such students who own a Texas Instruments calculator.(b) Of the 8 students who owned a TI calculator, 6 had graphing calculators. Estimate the proportion of students who do not own a TI graphing calculator.Periodically, the county Water Department tests the drinking water of homeowners for contaminants such as lead and copper. The lead and copper levels in water specimens collected in 1998 for a sample of 10 residents of a subdevelopement of the county are shown below. lead (μμg/L) copper (mg/L) 4.44.4 0.6430.643 2.42.4 0.570.57 1.51.5 0.460.46 2.62.6 0.8950.895 5.95.9 0.20.2 3.43.4 0.540.54 3.83.8 0.2450.245 1.61.6 0.5830.583 5.75.7 0.7690.769 1.71.7 0.2150.215 (a) Construct a 9999% confidence interval for the mean lead level in water specimans of the subdevelopment. ≤μ≤≤μ≤ (b) Construct a 9999% confidence interval for the mean copper level in water specimans of the subdevelopment. ≤μ≤≤μ≤
- Periodically, the county Water Department tests the drinking water of homeowners for contminants such as lead and copper. The lead and copper levels in water specimens collected in 1998 for a sample of 10 residents of a subdevelopement of the county are shown below. lead (μμg/L) copper (mg/L) 4.44.4 0.4840.484 2.72.7 0.0760.076 5.35.3 0.5950.595 3.33.3 0.1280.128 5.55.5 0.4690.469 1.71.7 0.4060.406 0.40.4 0.8480.848 0.70.7 0.0220.022 44 0.860.86 2.82.8 0.4250.425 (a) Construct a 99% confidence interval for the mean lead level in water specimans of the subdevelopment. blank≤μ≤blank (b) Construct a 99% confidence interval for the mean copper level in water specimans of the subdevelopment. blank≤μ≤blankThe activities required to service a car at the Exclusive Car Mart is summarised in the following table: Table 1: Activity Times and Predecessors Minutes Required Activity Description Predecessor Activity Optimistic a Most Likely m Pessimistic b A B C D E F G H Drain Oil Replace Filter Refill Oil Check Tyres Wash Windows Fill Fluids Service A/c Final Test --- A B, E --- D E C C, F 3 2 3 3 4 4 3 1.5 4.5 3 4.5 4 3 4 3 2 7 5 6 6 7 6 5 3.5 The variability in times required to perform each activity is due to the different types, sizes, and conditions of the cars to be serviced. Required Draw the activity network for this problem (either AON or AOA) Determine the Expected Time and Variance for each activity. Round to 2 decimal places where applicable. Show the activity schedule (ES, EF, LS, and LF) as well as slack. Determine and state the critical path for this project. This must be based on your work in c) and not by inspection.…A researcher wishes to study the relationship between education and income separately for individuals who have college degrees, and for those who don't. To this end, he interviews 100 individuals in each category. Survey results are listed in the table below. non college graduates college graduates avg education 13 yr 18 yr std. dev. education 2 yr 1.2 yr Sxx 396 yr2 143 yr2 Avg. Income $67,200 $84,950 std. dev. income $9,400 $10,500 correlation coefficient .25 .15 a. Use the data above to find point estimates for regression coefficients B0NG and B1NG for non-college graduates and BoG and B1G for college graduates. b. Propose an unbiased estimator for the difference theta=B1G - B1NG in slope coefficients for the two sub-populations, and show that B(theta hat)= 0. c. Assume that the error terms ENG and EG for non-graduates and graduates, respectively, are both distributed normally, with known standard deviation oENG = oEG = $ 10,000. In that case, determine the…
- Periodically, the county Water Department tests the drinking water of homeowners for contaminants such as lead and copper. The lead and copper levels in water specimens collected in 1998 for a sample of 10 residents of a subdevelopement of the county are shown below. lead (μμg/L) copper (mg/L) 4.4 0.643 2.4 0.57 1.5 0.46 2.6 0.895 5.9 0.2 3.4 0.54 3.8 0.245 1.6 0.583 5.7 0.769 1.7 0.215 (a) Construct a 9999% confidence interval for the mean lead level in water specimans of the subdevelopment. ≤μ≤Life-saving drug: Penicillin is produced by the Penicillin fungus, which is grown in a broth whose sugar content must be carefully controlled. Several samples of broth were taken on three successive days, and the amount of dissolved sugars, in milligrams per milliliter, was measured on each sample. The results were as follows. Day 1: 5.2 5.0 5.4 5.2 5.3 5.0 4.9 5.0 5.2 5.0 4.6 5.3 Day 2: 5.6 4.8 4.9 5.3 5.2 4.9 5.4 5.0 5.4 4.9 5.5 5.4 Day 3: 5.9 4.9 5.3 5.4 5.2 5.5 5.0 5.8 5.5 5.4 5.4 5.1 Construct an ANOVA table. Round your answers to four decimal places as needed. One-way ANOVA: Sugar Concentration Source DF SS MS F P Days Error TotalA chemical reaction is run 12 times, and the temperature xi (in °C) and the yield yi (in percent of a theoretical maximum) is recorded each time. The following summary statistics are recorded: x⎯⎯=65.0, y⎯⎯=29.03,∑ni=1(xi−x⎯⎯)2=6032.0,∑ni=1(yi−y⎯⎯)2=835.42,∑ni=1(xi−x⎯⎯)(yi−y⎯⎯)=1988.5x¯=65.0, y¯=29.03,∑i=1n(xi−x¯)2=6032.0,∑i=1n(yi−y¯)2=835.42,∑i=1n(xi−x¯)(yi−y¯)=1988.5 Let β0 represent the hypothetical yield at a temperature of 0°C, and let β1 represent the increase in yield caused by an increase in temperature of 1°C. Assume that assumptions 1 through 4 for errors in linear models hold. Find 95% confidence intervals for β0 and β1. Round the answers to three decimal places. The 95% confidence interval for β0 is ( , ). The 95% confidence interval for β1 is ( , ).